
If yesterday's market decline continues today, this may mean the cancellation of the optimistic scenario and the continuation of the global downtrend
BTC/USD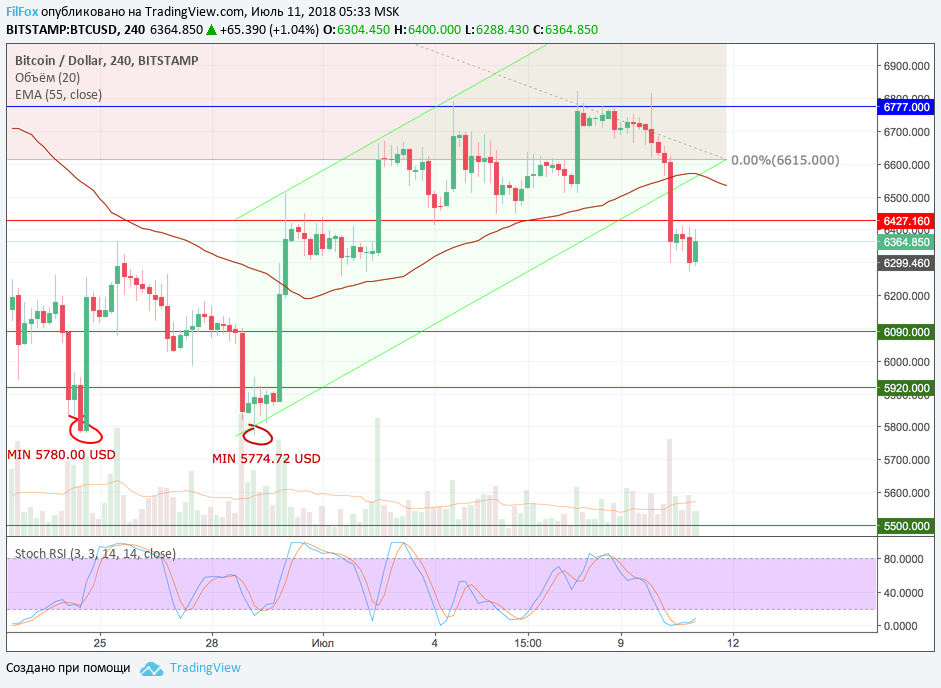
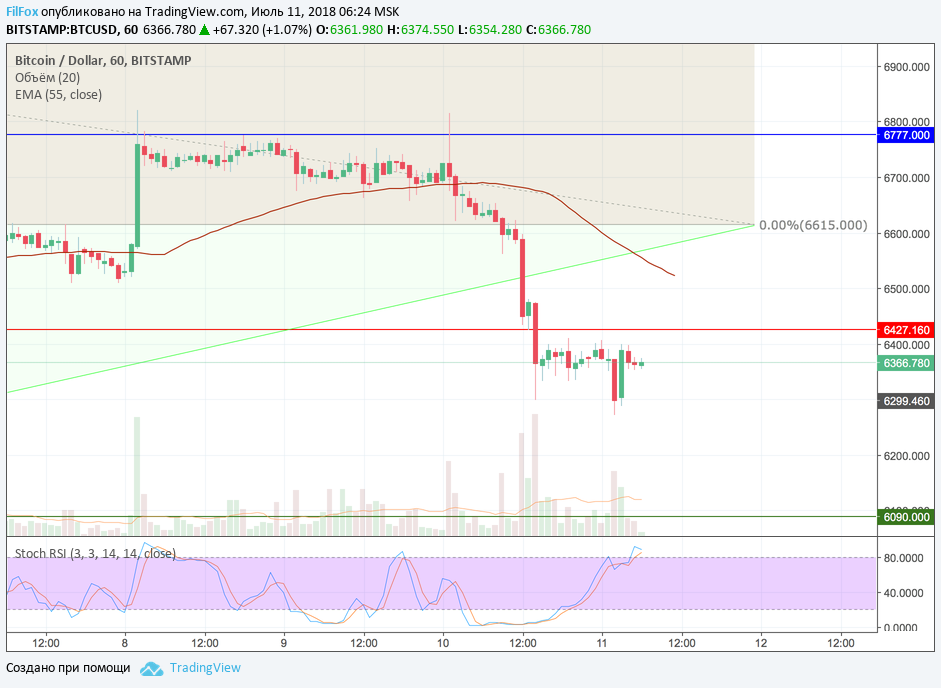
Yesterday’s re-test of the zero fibonacci level 6615.00 USD resulted in a breakthrough of this support and a decline to the area of the April Fool’s low - 6427.16 USD. During the decline, the price broke through the moving average EMA55 and broke through the lower border of the uptrend corridor. The price also failed to hold the reversal level of 6427.16 USD. The pair stopped falling only at the daily low of 6298.00 USD. In the second half of the day, the price tried to recover, but it was not yet possible to overcome the resistance of the red line 6427.16 USD.
Trading volumes decreased significantly and, instead of restoring the pair, we see how the price went into a sideways movement. Today, the pair has already managed to update yesterday’s daily low to 6270.00 USD and another attempt to recover at least to the level of the April Fool’s low of 6427.16 USD again ended in vain. The narrow range of the sideways trend does not allow the price to even test the red resistance level.
We believe that the sideways trend, which moved from the level of 6777.00 USD to the level of 6427.16 USD, will continue today. If the bears again seize the initiative and push the price to the support of 6090.00 USD, this will mean the cancellation of the optimistic scenario and the refusal to continue the upward trend. Then, in the medium term, the pair will update annual lows and probe the bottom for another attempt to reverse the downtrend.
ETH/USD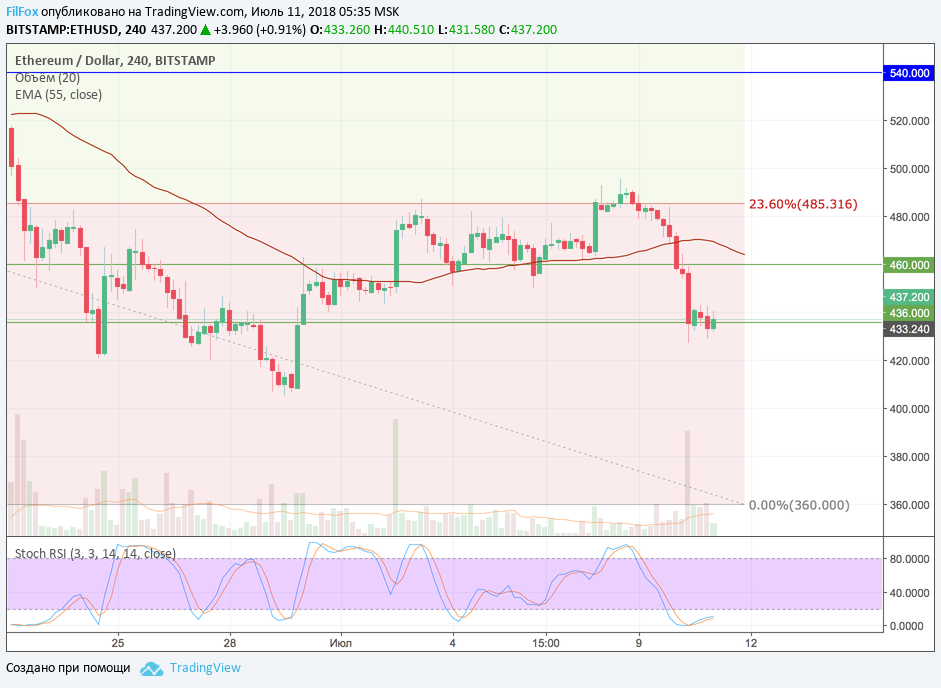
Yesterday, from the average price level, Ethereum fell to the support level of 436.00 USD. In the afternoon, the price made two unsuccessful attempts to gain a foothold above this level, and today it will have to repeat it all over again from the level of 433.00 USD.
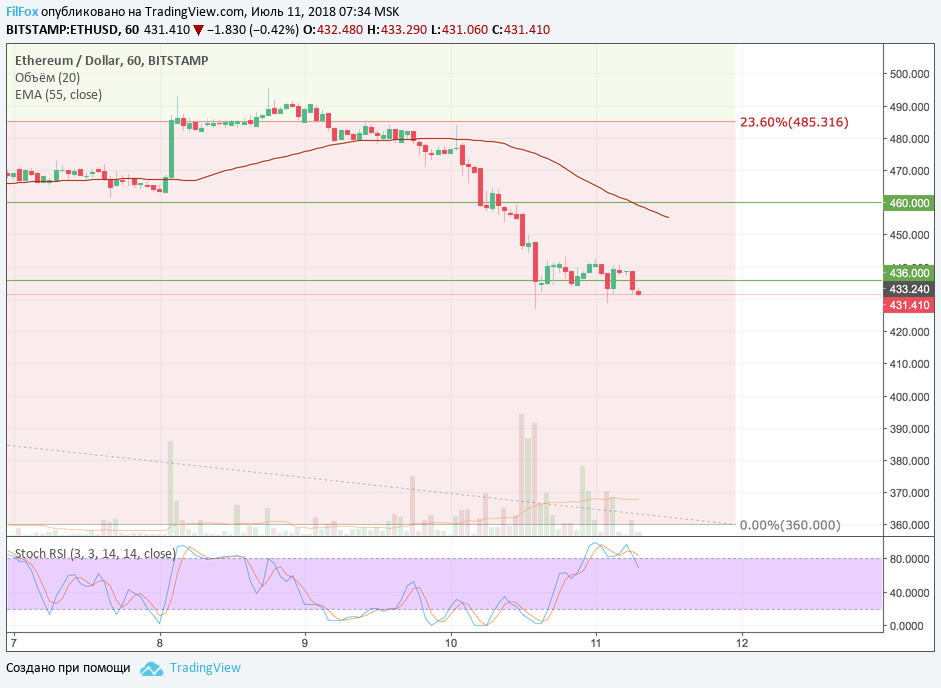
This narrow sideways trend may end in a continued decline to the area of 412.00 USD. If the bears continue to build on their success, then a decline in prices to the area of 380.00 USD will cancel the upward trend and will update the lows in the medium term.
XRP/USD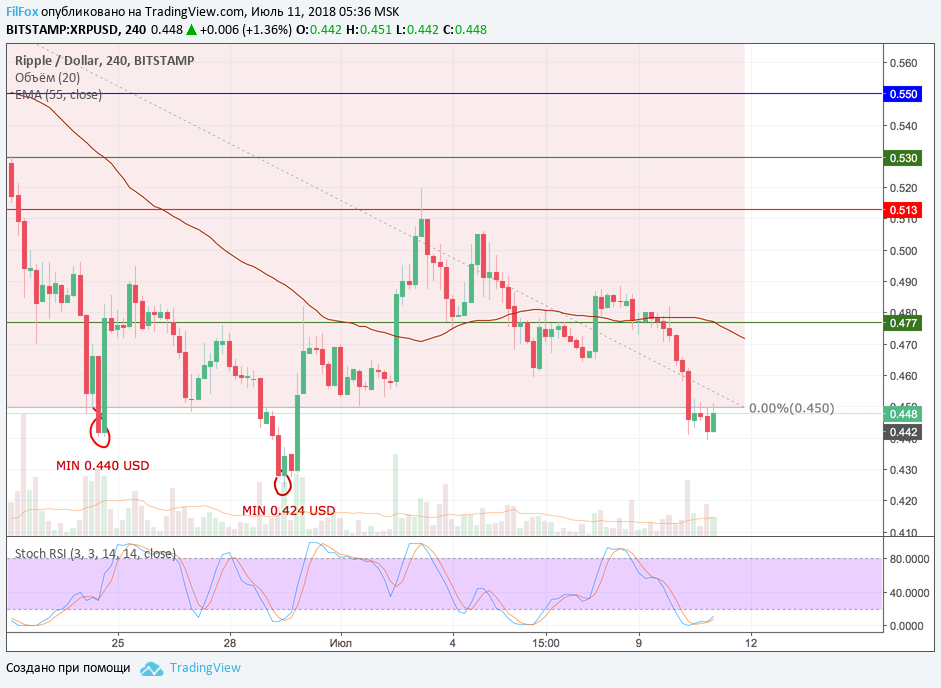
The XRP/USD pair fell below the zero fibonacci level yesterday (0.450 USD).. Later, attempts were made to recover above this resistance level, but the price failed to gain a foothold above it. Today, the fuss in a narrow range may still continue, but the hope for a price recovery is fading before our eyes. If the pair drops below the level of 0.430 USD, then you can forget about the upward trend.
Subscribe to our Tradingview profile and never miss another review! https://ru.tradingview.com/u/FilFox/
* All price values are based on data from the BitStamp exchange

You May Also Like
Analysis of Bitcoin Cash, Stellar Lumen, EOS and Litecoin as of November 16, 2018
On the eve of the weekend, trading volumes will gradually fade and altcoins will consolidate in a sideways range, near the nearest support levels
Analysis of Bitcoin Cash, Stellar Lumen, EOS and Litecoin as of November 29, 2018
The correction phase continues and new daily highs are expected today