
The bearish impulse that caused the Bitcoin price to fall led to a decline in prices for other altcoins
BTC/USD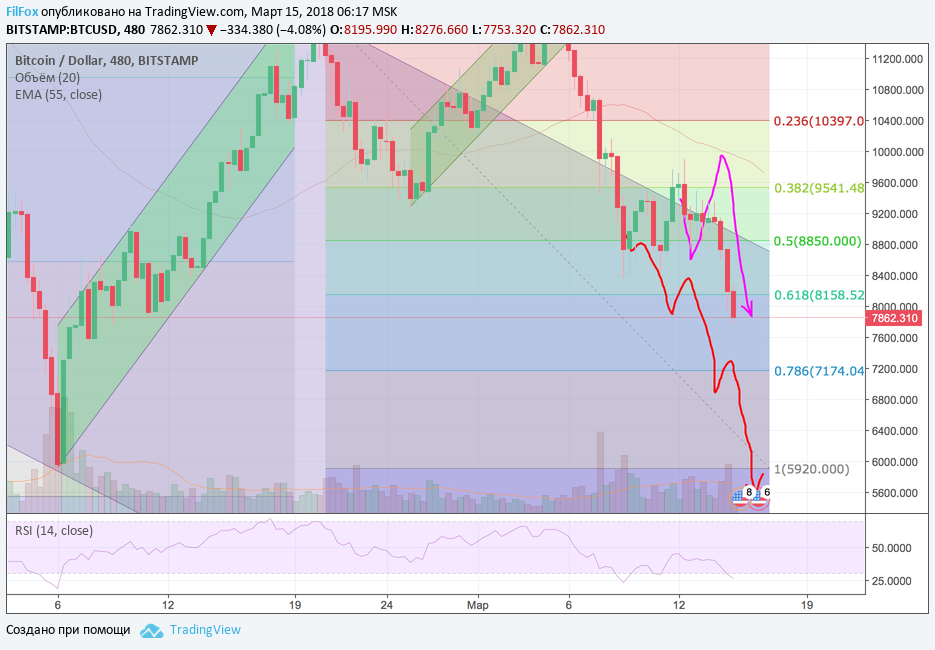
The Bitcoin price yesterday received a bearish impulse and exited a narrow consolidation range. At the end of the day, the daily low was set at 8201.00 USD. There is an opinion among investors that the wave of sales is associated with Google’s announcement of ban in the search engine, since June 2018, advertising related to cryptocurrency and ICO.
Today, the Bitcoin rate continued to fall and the current market value is around 7 800.00 USD. The RSI indicator has left the neutral zone and signals that the market is oversold. Therefore, today, at this level, the fall will slow down and the price will recover slightly. Thus, we can talk about confirmation of the forecast movement indicated by the purple arrow. Further, after consolidation ends, the movement towards the next target level along the red arrow will continue.
ETH/USD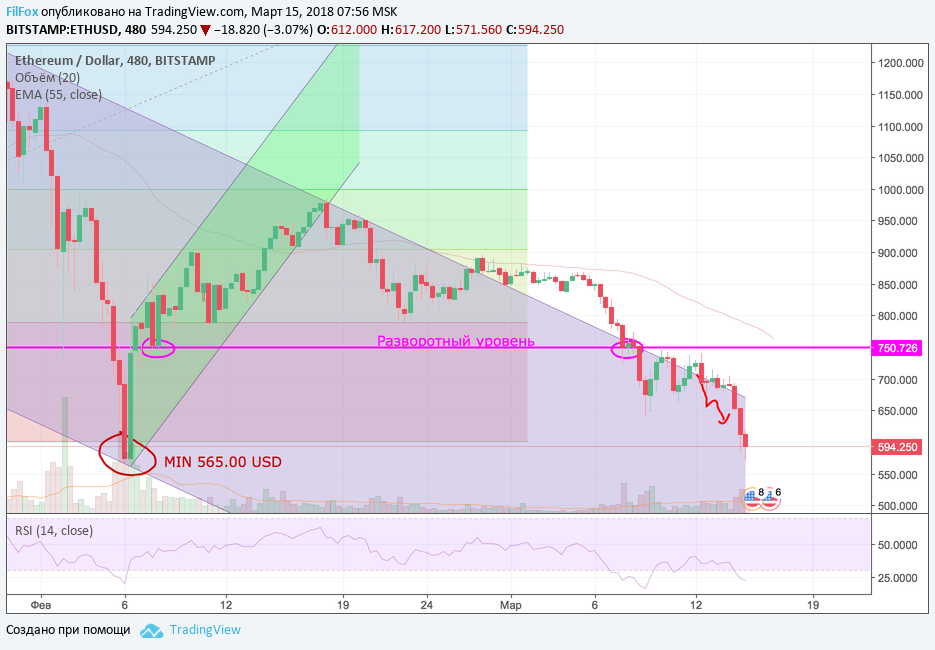
Ethereum yesterday came out of a narrow sideways trend and the price was looking for support at the zero fibonacci level (600.00 USD). As a result, the daily minimum was set at 584.00 USD. Today the price continued to fall, but the minimum of 565.00 USD, set on February 6, 2018, has not yet been updated. At the moment, the fall has slowed down and consolidation is expected before this minimum value is updated.
XRP/USD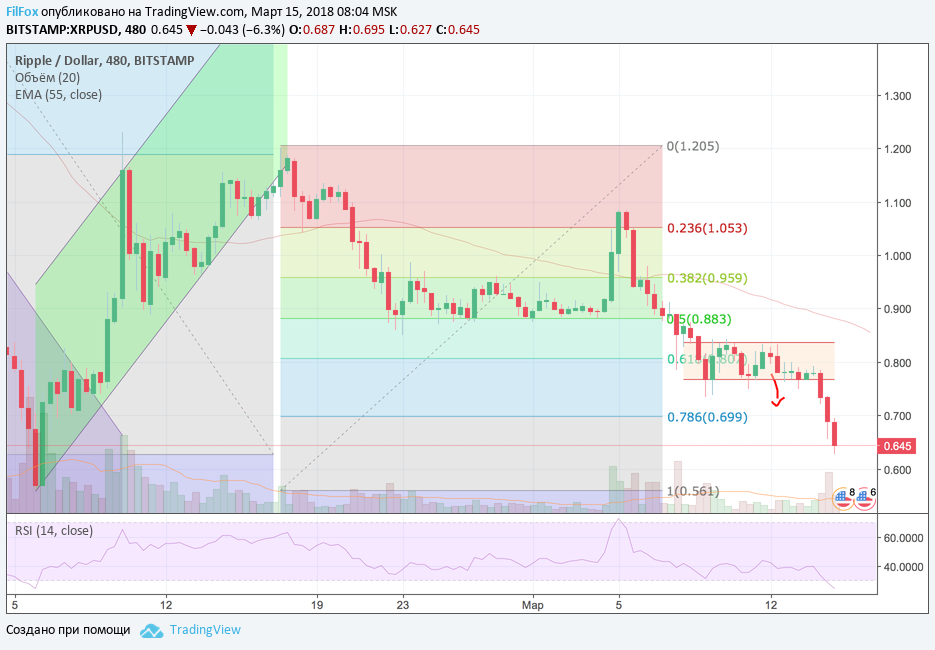
Yesterday, without possible false breakouts, the price of Ripple left the rectangle in the direction of continuing the downtrend. After breaking through the 78.6% fib support level (0.699 USD), the daily low was set at 0.656 USD. Today, although the fall in the Ripple rate continued, it slowed down significantly around 0.646 USD. The price is expected to decline further after some consolidation.
Subscribe to our Tradingview profile and never miss another review! https://ru.tradingview.com/u/FilFox/

You May Also Like
Analysis of ADA and XMR as of November 26, 2018
After several weeks of severe price losses, some of the altcoins may recover to the nearest resistance level.
Technical analysis from June 6 to June 10: fear dominates the market
In the last few weeks, we have seen a range of around 10 on the fear and greed index, which tells us that fear is dominating the market.