")
In today's review, as always, we will analyze the market for three cryptocurrency pairs BTC/USD, ETH/USD, XRP/USD over the past week and consider the forecast for price movements in the next two to three days
BTC/USD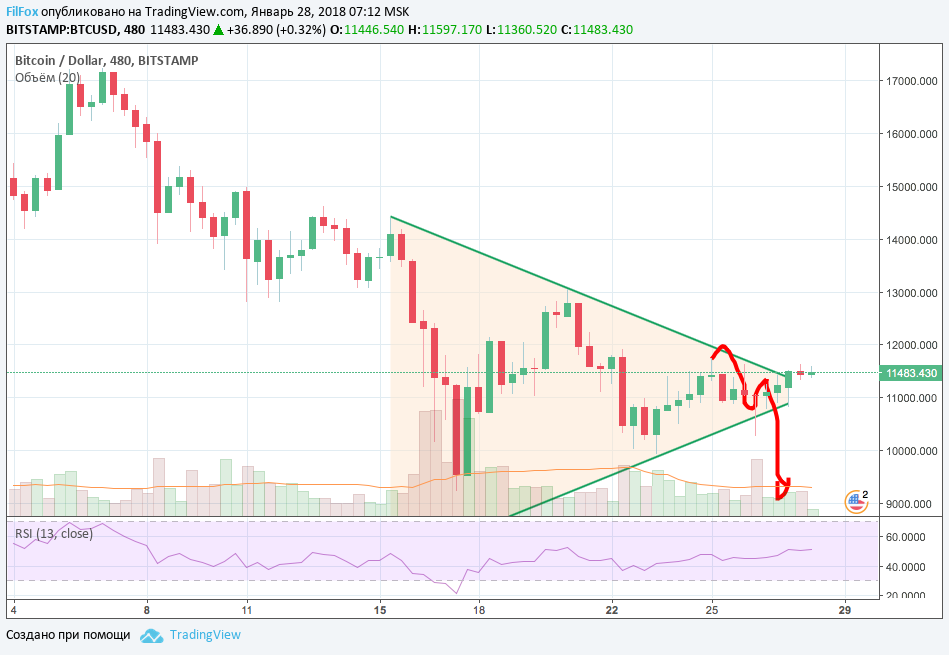
The current week for Bitcoin has been unusually calm. All week the price was limited by the “converging triangle” graphic pattern, and only on Friday, there was a false breakdown of the lower border of the triangle, after which the price quite quickly returned to the range limited by this figure. In technical analysis, the triangle is a basic pattern that is often found on all time frames. With its help, you can determine the further price movement: if, for example, during a downward trend, the bisector of the triangle is directed downward, then the downward trend will continue, and if it is upward, then you should expect a reversal and a change in the trend to an upward one. In our triangle, the bisector is located horizontally. It is generally accepted that in this case, the trend will most likely continue. When leaving any triangle, the trend impulse is equal to approximately half of the bisector, therefore, the longer the price waits for the impulse, the stronger the impulse movement will be. Before breaking through the border of the triangle, so-called “false breakouts” often occur. This is a situation when the price breaks through the border of the figure, simulating an impulse, but then returns to the previous level. False breakouts can be fast and quite deep. They occur, in turn, in opposite directions and are unpleasant because they knock down a pending order with a set “stop-loss”.
Thus, we can conclude that in the near future, for the BTC/USD pair, we will see another false breakout and an impulse movement to continue the downward trend. However, we understand that the slope of the triangle bisector did not give a clear signal for a downtrend, so the likelihood of a reversal and a change in the trend to bullish still remains.
ETH/USD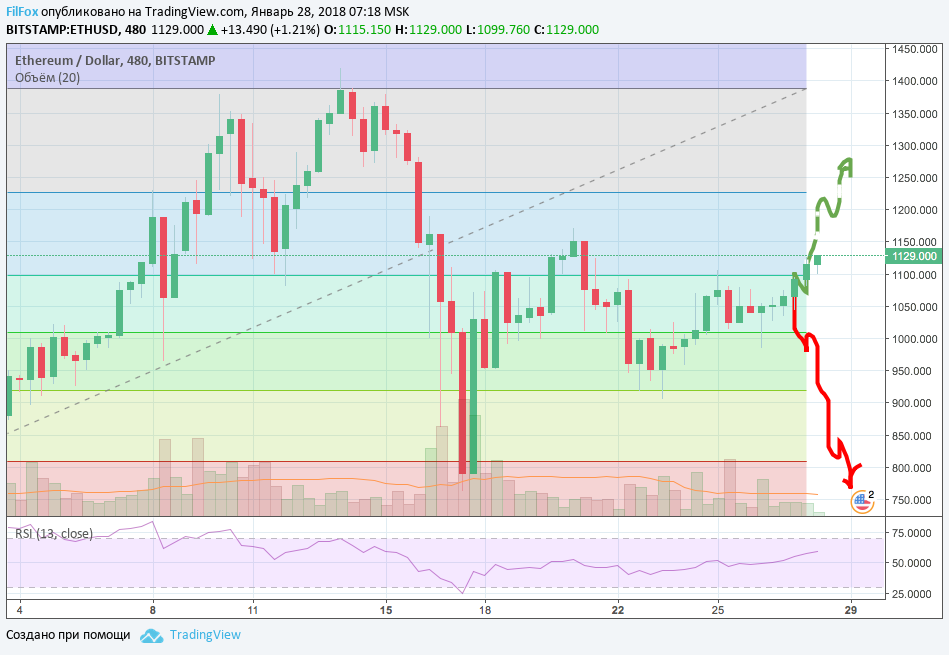
The price of Ethereum at the beginning of the week fell below the psychological level mark of 1000.00 USD per ether, and for three days in a row, tried to overcome this resistance level. On Wednesday, this attempt was successful; the ETH/USD pair was able to consolidate in a narrow range near the level of 1040.00 USD. A breakdown of the upper limit of resistance at 61.8% fibonacci (1100.00 USD) means a change in the downward trend that began on January 14 and a restoration of the price of ether to the area of 1300.00 USD..
If the breakout turns out to be false and the price cannot consolidate above the 78.6% fibonacci level (1226.00 USD), then the price will roll back to the resistance level of 1000.00 USD.
XRP/USD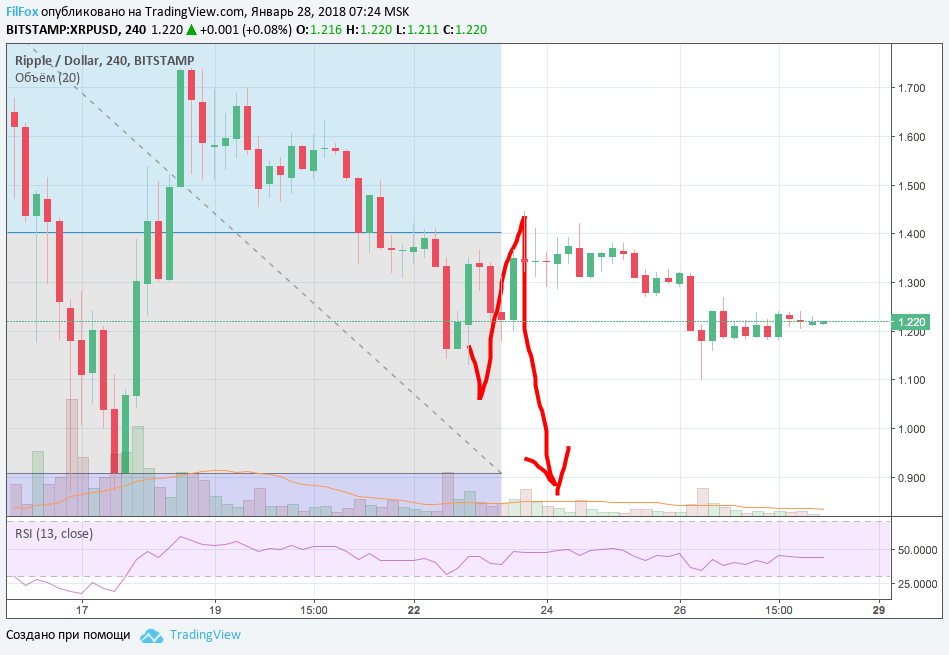
After the XRP/USD pair showed a minimum at 1.13 USD on Monday, the price was able to recover to the resistance level of 78.6% fib (1.402 USD) and consolidate in a very narrow corridor, not typical for cryptocurrency, around the 1.222 USD line. The low price spread is due to low trading volume, and indicates a decrease in investor interest in Ripple this week. This is quite natural: traders do not enter the market because there is no clear signal about whether the downtrend will continue or the trend will change to bullish.
As long as the sideways movement continues, it is not recommended to open trades. The cryptocurrency market, like no other, is subject to fluctuations against the background of events, so it is necessary to monitor more news related to the world of cryptocurrency.
To confirm a change in trend, you need to wait for the price to consolidate above the resistance level of 78.6% fibonacci (1.402 USD), then Ripple will be able to recover to the usual psychological level of “two dollars per coin.” Otherwise, the bearish trend will continue to the area of minimums, where Ripple will cost no more than ninety cents.

You May Also Like
Analysis of cryptocurrency pairs BTC/USD, XRP/USD and ETH/USD as of November 16, 2018
The crypto market, being an investment instrument, has become an integral part of the global financial system. It seems that negative trends in financial markets are increasingly influencing the young cryptocurrency market
Analysis of Bitcoin Cash, EOS, Stellar Lumen and Litecoin as of 11/12/2018
The altcoin market tried to stay flat over the weekend, but the decline resumed in the morning. Only the price of Stellar Lumen was able to remain in the ascending corridor. Will the support level stop prices from falling further?