")
Bitcoin saw growth all week, while Ethereum and Ripple lay on their side for six days
BTC/USD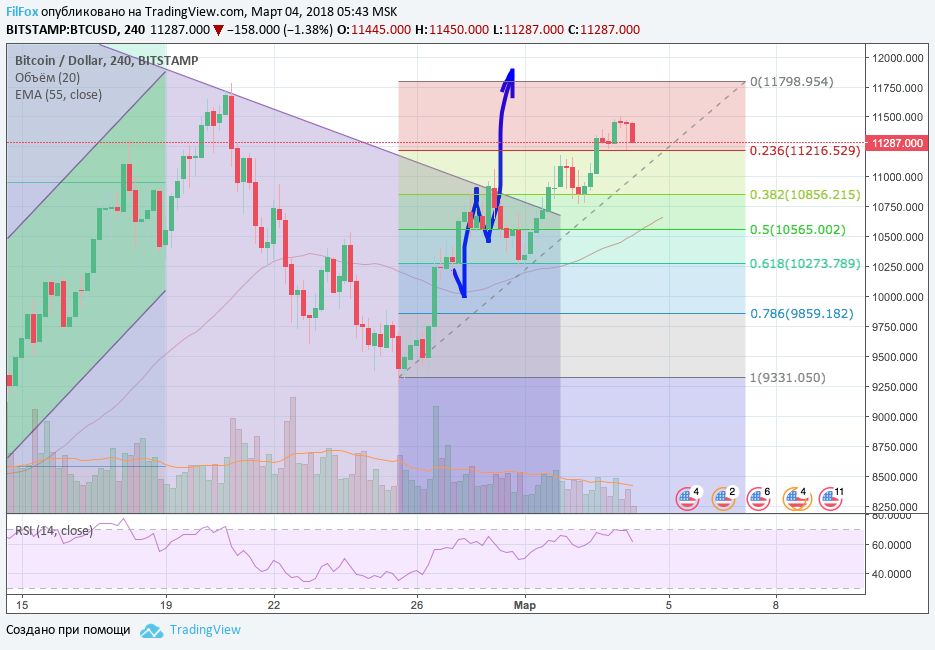
The outgoing trading week was dominated by the bulls, who over the past six days were able to raise the price of Bitcoin from a low of 9,376.00 USD to a weekly high of 11,500.00 USD. Bitcoin capitalization increased by 30 billion over the week, from $163 billion to $193 billion. The bullish impulse is still in force, and the BTC rate may reach a strong resistance level of 11,800.00 USD by the end of the week, followed by a correction, the depth of which may be limited to 38.2% fibonacci (10,856.00 USD).
Yesterday we tried to predict the nature of the price movement from the support level of 38.2% fibonacci (10,856.00 USD) to the resistance level 11,800.00 USD. The assumption that the price will rise without sharp impulses, consolidating at the support level of 23.6% fibo (11,236.00 USD) turned out to be correct. At the same time, the relative strength indicator RSI remained at the upper limit of the neutral zone all the time. Any sharp bearish impulse can lead the market into the overbought zone, and then a local price reversal will follow. According to our calculations, this border coincides with the resistance level of 11,780.00 USD.
Whether the price, on Sunday, will be able to reach the target level that we set in the forecast of 02/27/2018 at the level of 11,800.00 USD or will transfer this significant moment to the beginning of next week, we will find out today, March 4.
ETH/USD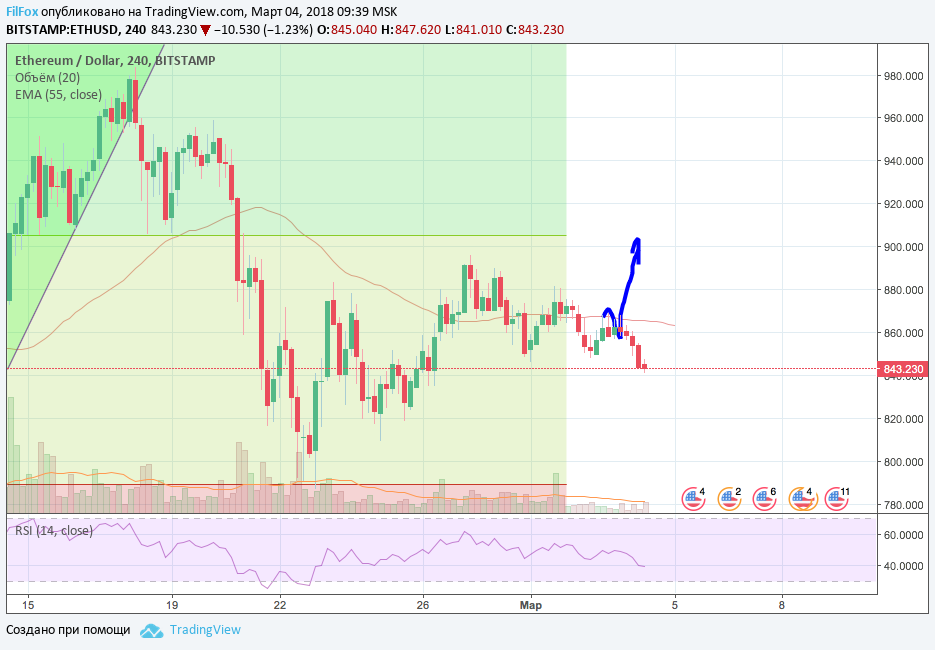
Etereum fluctuated around the moving average EMA55 all week, and today the price, having refused the next re-test of EMA55, began to slide towards the support level, in the area of 820.00 USD. The decline in ETH will continue until the price of BTC/USD, having found support, begins to rise again.
XRP/USD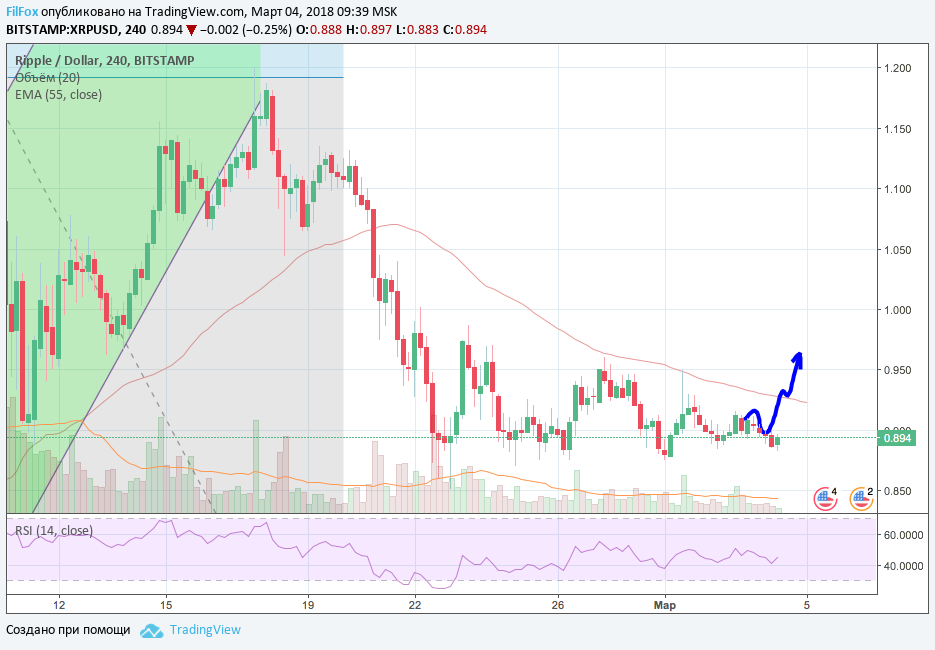
Ripple was in a sideways range for six days, constantly narrowing the amplitude of deviation from its equilibrium state at the level of 0.905 USD. But even a temporary decrease in the price of BTC did not bring the XRP/USD pair out of this equilibrium position. Now the only question that remains is whether XRP growth will react to the bullish momentum of BTC/USD (if it happens today, of course).
Subscribe to our Tradingview profile and never miss another review! https://ru.tradingview.com/u/FilFox/

You May Also Like
Analysis of cryptocurrency pairs BTC/USD, XRP/USD and ETH/USD as of December 27, 2018
Yesterday the market continued to consolidate in a sideways range. Exit from the rectangle is more likely in the downward direction.
Analysis of Bitcoin Cash ABC, Stellar Lumen, EOS and Litecoin as of 11/19/2018
After market consolidation last weekend, prices resumed falling. Today the annual minimums are expected to be updated again.