")
In today's review, as always, we summarize the results of the outgoing week and analyze the overall price dynamics
BTC/USD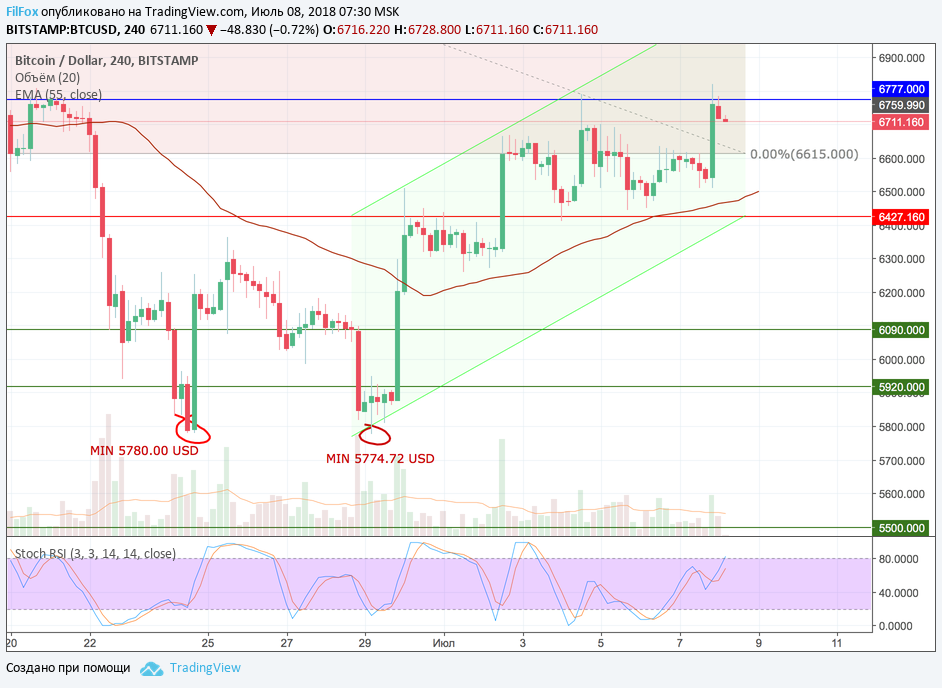
Last weekend, Bitcoin tested the resistance of the April Fool's low of 6427.16 USD and lay in a wedge-shaped sideways pattern below this level for the entire weekend. This week was supposed to be historic. According to technical analysis, confirmation of a reversal of the global downtrend to an uptrend is the price consolidating above the key resistance level of 6777.00 USD.
It was expected that this would happen this week and positive fundamental events would be able to reverse the negative mood that has been suppressing the growth of the cryptocurrency market for more than six months. In January 2018, the total market capitalization peaked at $830 billion and currently stands at just $277 billion.
Global positive news is gradually giving confidence to market participants. The American regulator SEC is quite loyal to registration of exchange-traded investment funds (ETF) based on Bitcoin.
The Coinbase exchange is introducing a service Coinbase Custody, aimed at supporting large cryptocurrency companies. A similar Custody Solution service to attract large institutional investors to the crypto market is being introduced by the Japanese bank Nomura.
However, at the moment we see how the price, being sideways at the zero fibonacci level (6615.00 USD), broke through the key level 6777.00 USD for the second time this week, but has not yet been able to gain a foothold above it. We believe that the development of our positive forecast is still relevant. Today the price may roll back from the high at 6820.00 USD to the area of 6660.00 USD or to the 0% fib support (6615.00 USD) and in the near future again try to overcome the key resistance 6777.00 USD.
ETH/USD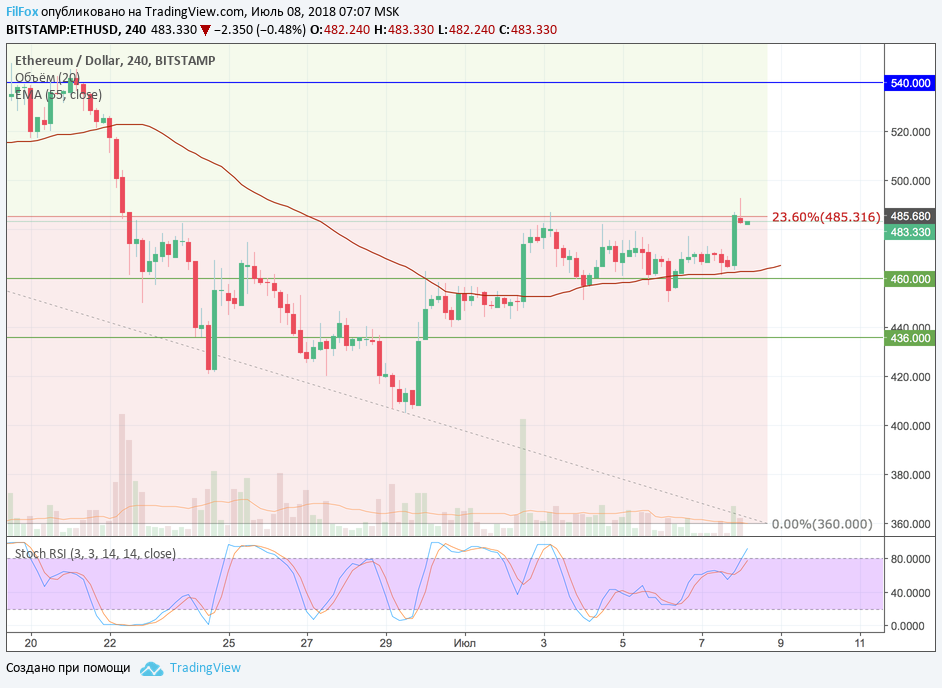
A similar situation with BTC dynamics was observed this week for all highly liquid altcoins on the market. Ethereum spent the week sideways at the 23.6% fibonacci level (485.31 USD). The price touched this level at the beginning of the week, and then periodically decreased to the area of average prices. Yesterday, after another re-test of the moving average, the pair received support from the EMA55 curve and was able to jump over the 23.6% fib resistance (485.31 USD) in an hour...
A pullback from the high at 487.00 USD will cause the pair to consolidate below this resistance level. We still hope for a bullish breakthrough and confirmation of the uptrend. We believe that support for short-term consolidation will be located somewhere around 480.00 USD.
XRP/USD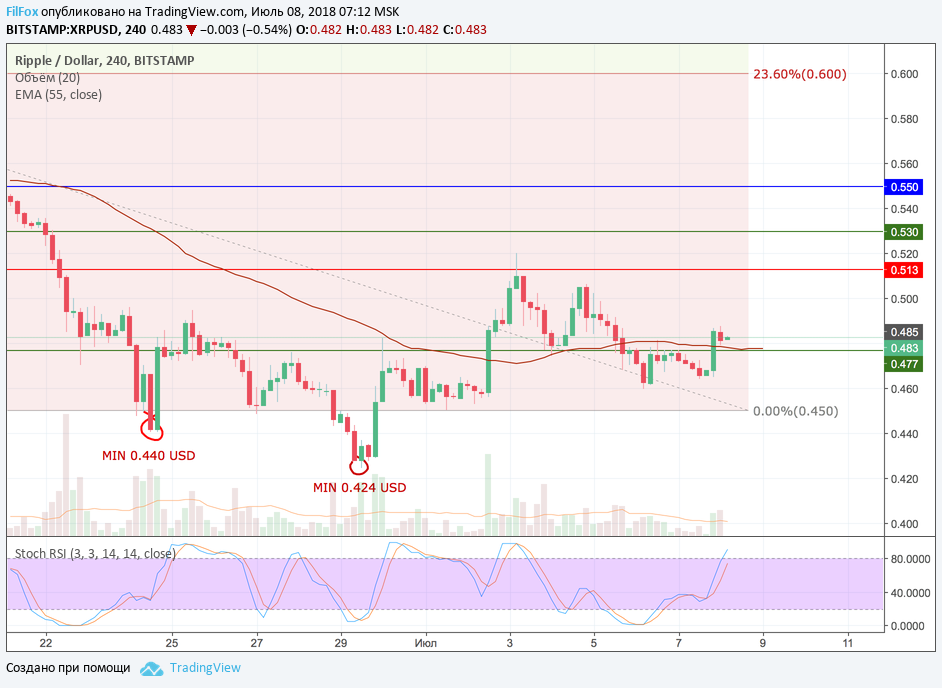
Ripple, being one of the representatives of highly liquid altcoins, as always, has recently time, completely correlated with the dynamics of the BTC/USD pair. A stormy start to the week was marked by a breakdown of the resistance at 0.513 USD and a high at 0.520 USD. But the rollback to the level of average prices and subsequent consolidation occurred with a fairly high amplitude.
Yesterday, from the daily low of 0.464 USD, the pair on the rise broke through the resistance of the moving average EMA55, which had not been overcome since Thursday. We believe that in an optimistic scenario, the cryptocurrency locomotive BTC/USD will be able to quickly lift XRP from the area of annual lows, first to the psychological level of “50 cents per ripple”, and then even higher according to the uptrend.
Subscribe to our profile on Tradingview and do not miss a single review! https://ru.tradingview.com/u/FilFox/
* All price values are based on data from the BitStamp exchange

You May Also Like
ADA/USD analysis as of November 30, 2018
Cardano currency is good for its regular updates, which give a clear picture of the development process, which also affects the price. On the hourly chart we see a short-term bullish trend line with support at $0.0410.
Analysis of cryptocurrency pairs BTC/USD, XRP/USD and ETH/USD as of December 22, 2018
At weekly highs, the market turned into a downtrend. The pullback and consolidation will continue with a decline towards the nearest support levels.