")
Our forecast, compiled on March 9, is still relevant and, it seems, should be fully fulfilled in the near future
BTC/USD
On Monday, March 12, the recovery of the Bitcoin rate ended with the fixation of the weekly maximum at 9,892.00 USD (As always, in our reviews, we use rate values based on data from the BitStamp exchange). 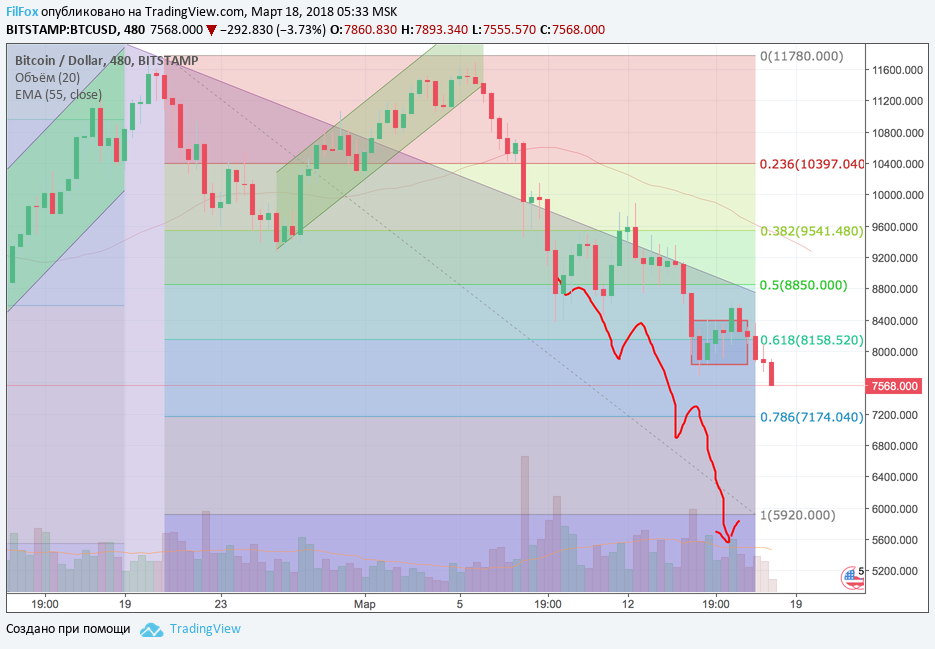
The BTC/USD rate, on the first day of this week, was quite volatile and showed a price decline of more than 1,100.00 US dollars, setting a minimum in the evening at 8,742.00 USD. Wednesday turned out to be even more severe, when the price fell by $1,400.00 in one day. From Thursday to Saturday, the price consolidated in the range of the rectangle, testing the strength of its upper limit at the level of 8400.00 USD. Today, on Sunday, the price broke through the lower border of the rectangle at the level of 7830.00 USD, and continued to decline to the next support level of 78.6% fibonacci (7,174.00 USD).
All week, the bearish mood in the market was supported by negative fundamental news related to restrictions that will affect ICO and cryptocurrency advertising in the Google search engine, as well as expectations of a new round of government regulation after the G20 summit.
The publication in the Financial Times did not add optimism to an interview with the financial director of the Visa payment system, Vasant Prabhu, who is known for his archaic views on the financial system. In the interview, he repeated common cliches regarding cryptocurrency, reproaching that it is a financial tool for corrupt politicians and scammers.
As a result, the pressure of the information field can be expressed in specific figures: over the current week, the capitalization of Bitcoin fell from 168 billion US dollars to 40 billion and now stands at about 128 billion dollars.
ETH/USD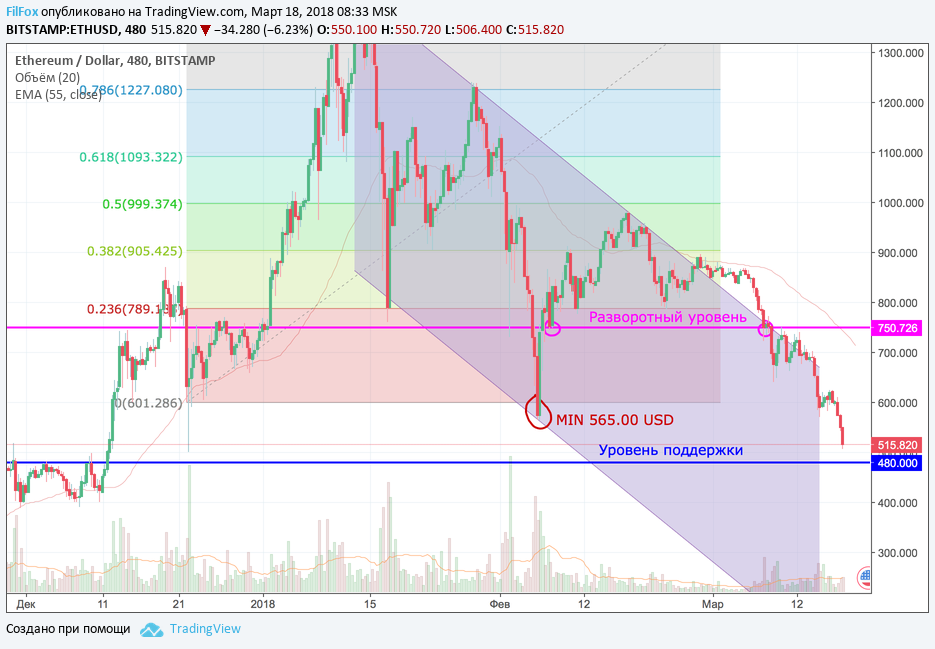
Ethereum capitalization decreased by $22 billion over the week, falling from 72 to 50 billion. During the week, the fall of ETH/USD looked as dramatic as BTC/USD, although it completely repeated the dynamics of the flagship, but Ethereum was the first of the three major cryptocurrencies to update the key minimum value on February 6, which was recorded at 565.00 USD. Today, the price of ether is falling in search of the nearest support level. We believe that the fall will slow down near the price area of 480.00 dollars per ether..
XRP/USD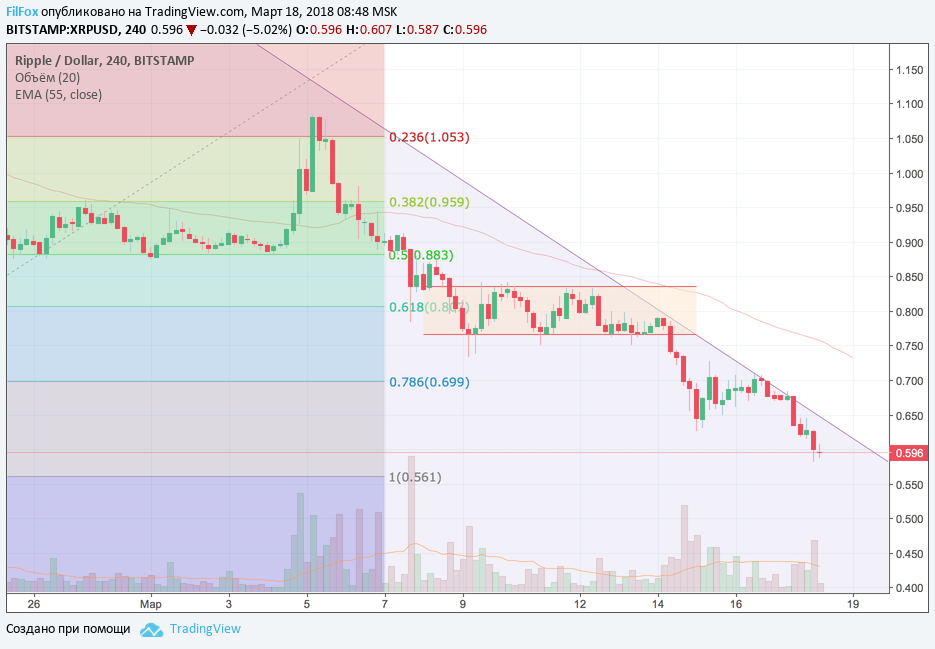
If we evaluate the price drop over the week as a percentage, then Ethereum lost about 30%, and Bitcoin and Ripple about the same, 23% each. Therefore, BTC and XRP have not yet updated their key lows from February 6, but have approached them by one bearish impulse. Support for Ripple could be a level just above the pivot point of 02/06/2018, somewhere in the area of 0.580 USD.
Subscribe to our Tradingview profile and don’t miss another review! https://ru.tradingview.com/u/FilFox/

You May Also Like
Analysis of EOS, Stellar Lumen, Litecoin and Bitcoin Cash as of 12/18/2018
A pullback from yesterday's highs will return altcoin prices to the nearest support level.
Analysis of Bitcoin Cash, Stellar Lumen, EOS and Litecoin as of November 23, 2018
Today the price has emerged from yesterday’s consolidation and some altcoins even managed to update their lows. But we believe that after the end of the corrective recovery, prices will continue the sideways trend.