
Despite the small profit margin, LTC prices are rising above the triangle, we just have to wait for a surge above $225. Then we'll start buying
XLM/USD 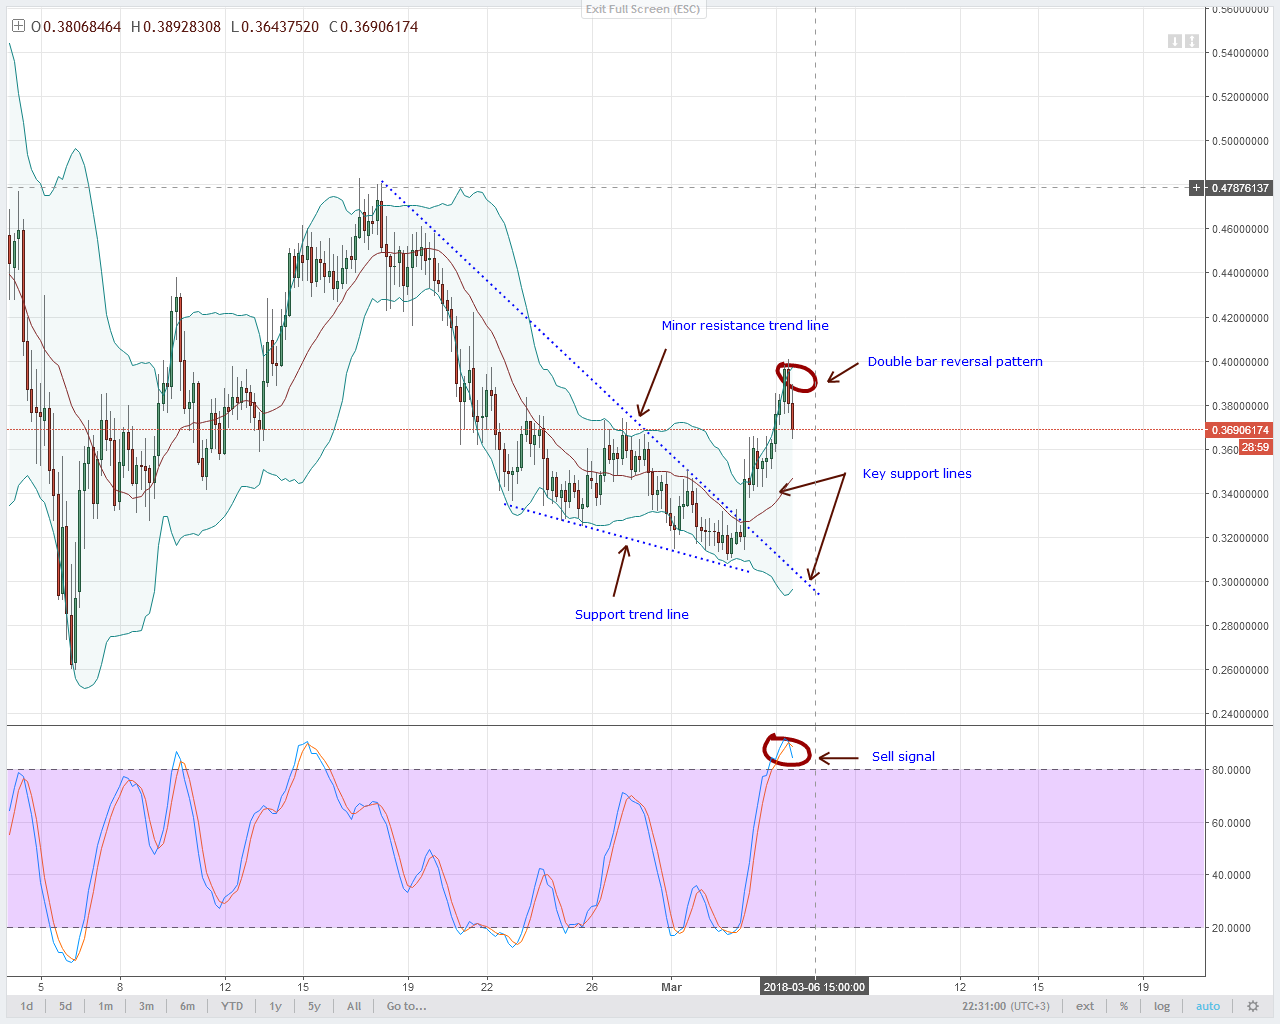
In order for us to start buying Lumen, we need to wait for confirmation when prices go above $0.40 - the key trigger in our analysis.
From yesterday's charts we can see that Lumen rose above the BB average and $0.40 for a while. We are waiting for a convincing close or a breakout, either of which would be a signal to place long entries. Given our bullish strategy, buyers should enter during reversals at key support levels.
XMR/USD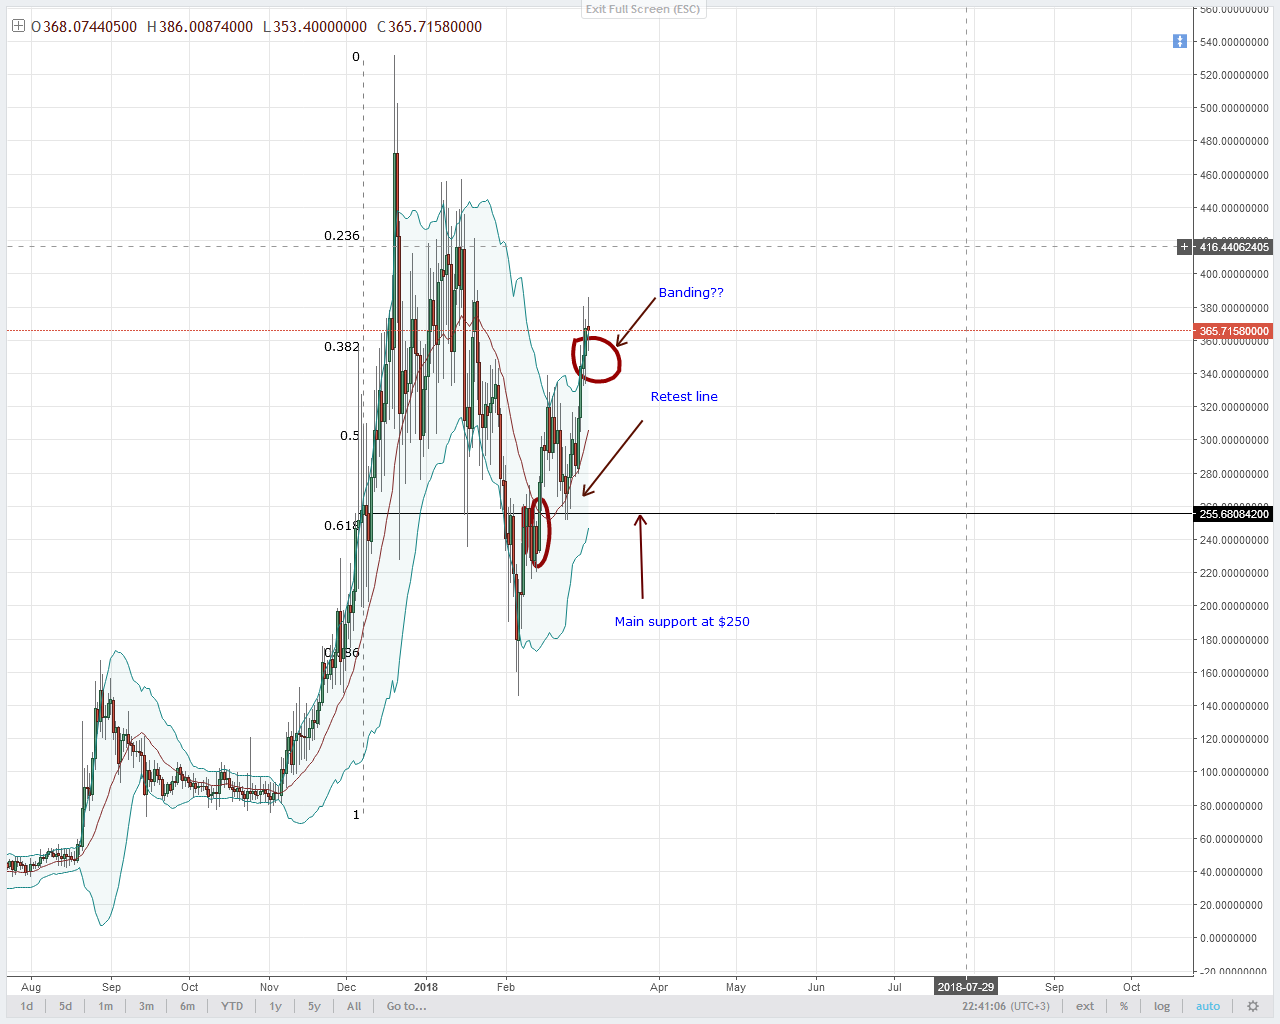
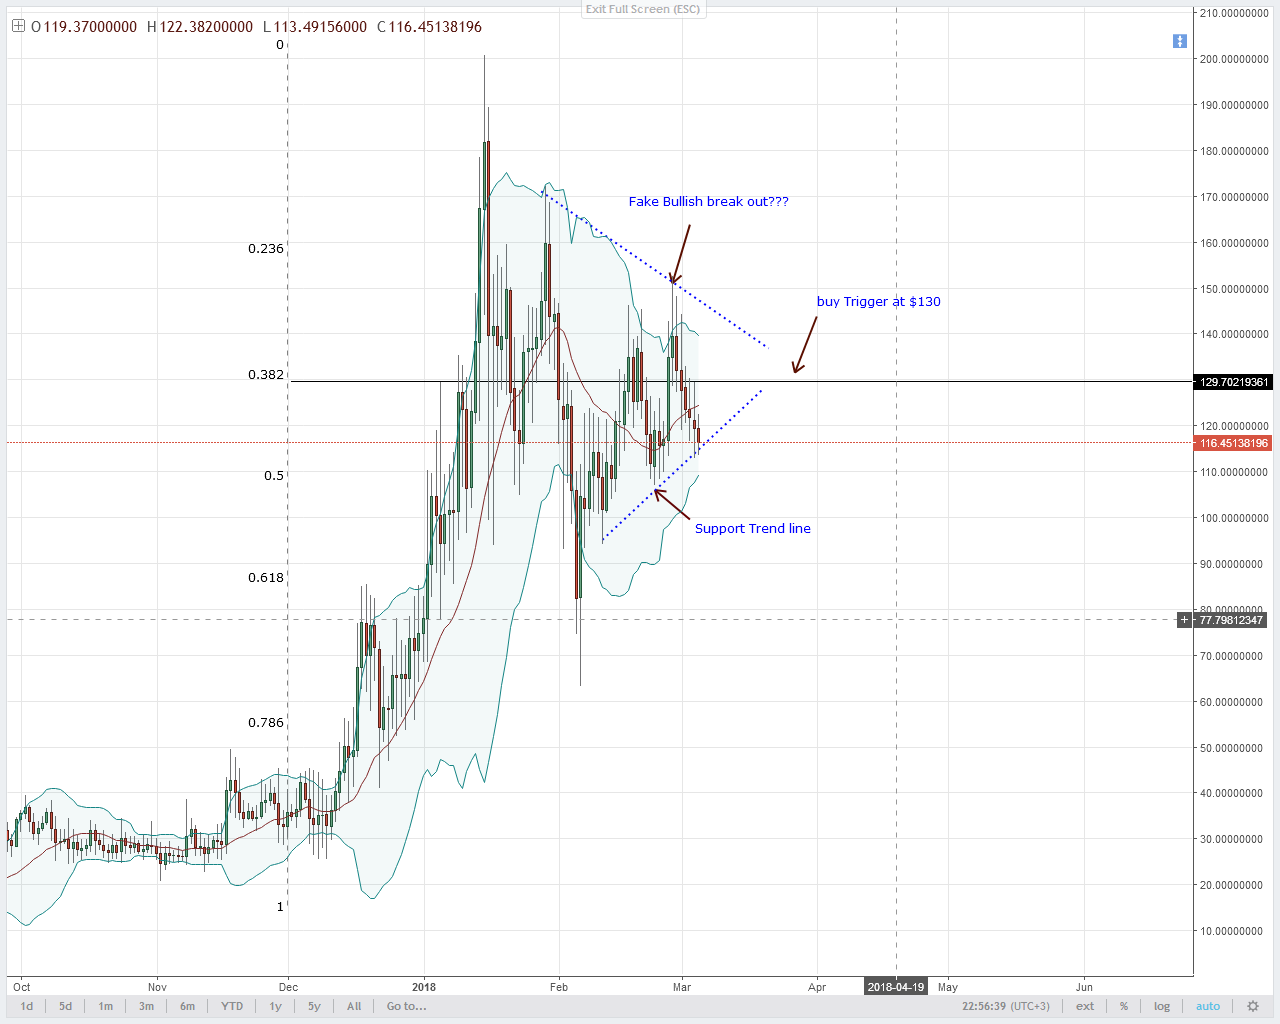
Monero's recent price rise has been quite impressive, with prices currently testing the 38.2% fibonacci resistance line.
This pair has seen some nice price action and while we are bullish, buyers should be aware that Monero is testing a key resistance line. Let's also acknowledge the fact that buyers are the driving force behind Monero's price.
Based on the charts, we are in the third phase of a bullish breakout, and if so, Monero may not close above the 38.2% fib, which is our immediate resistance line. Also, notice how the bullish candlestick bottoms are positioned along the upper BB on the daily time frame.
Today I would remain neutral and if bearish movements are present today, there is a high probability that sellers will push prices to support levels.
EOS/USD 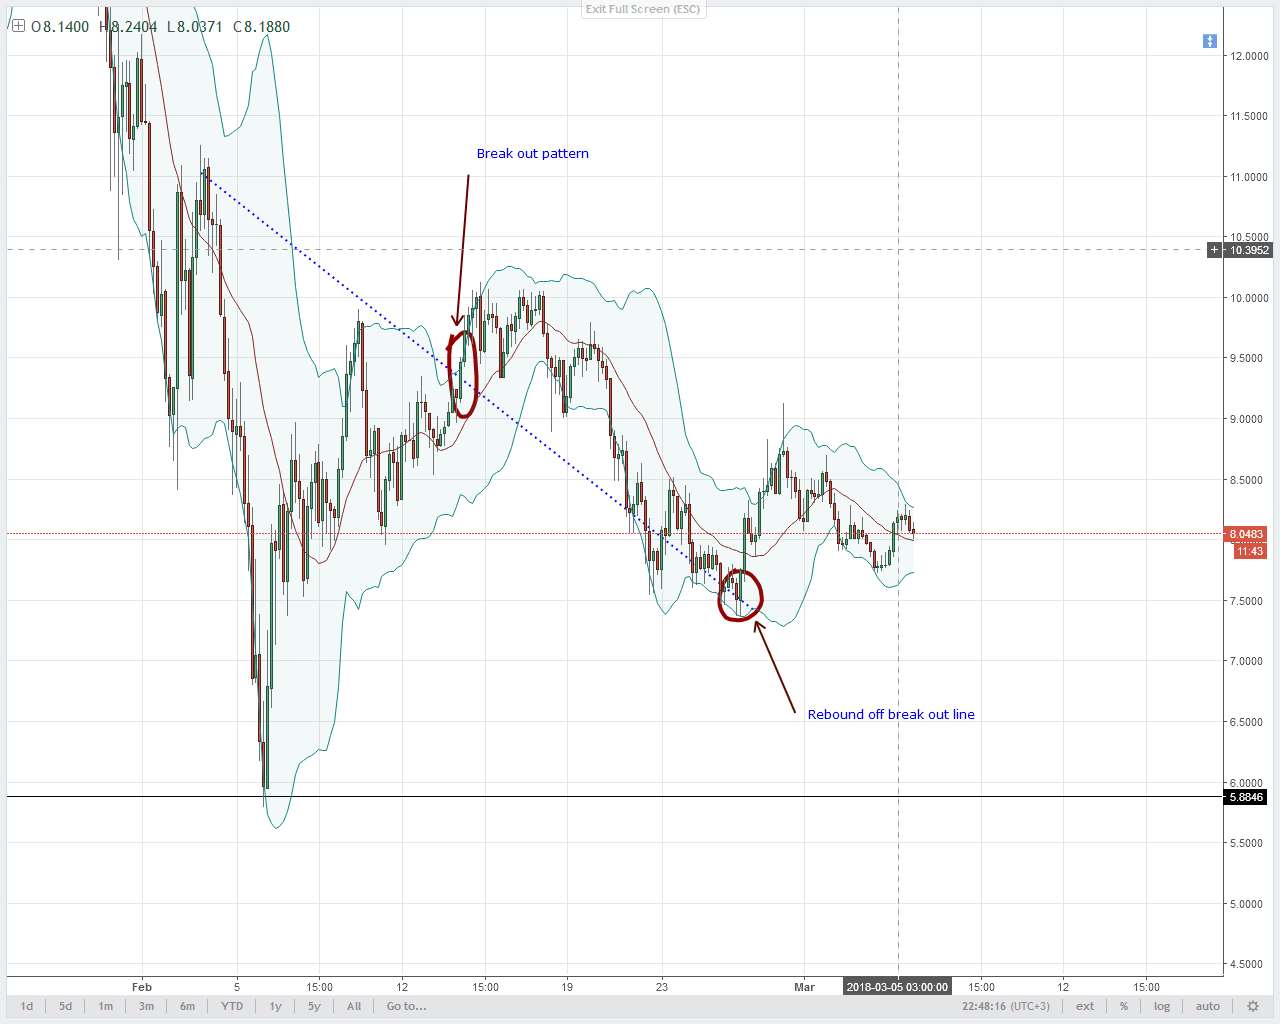
EOS continues to show sluggish price movements, our forecast for this pair remains the same.
With low volatility, I expect the average BB on the four-hour time frame and $8 to become our short-term support level as we expect prices to rise in the coming sessions.
If we see buyers pushing prices above $8.2 today, then we remain positive and may even move our short-term entries to the $10 level.
LTC/USD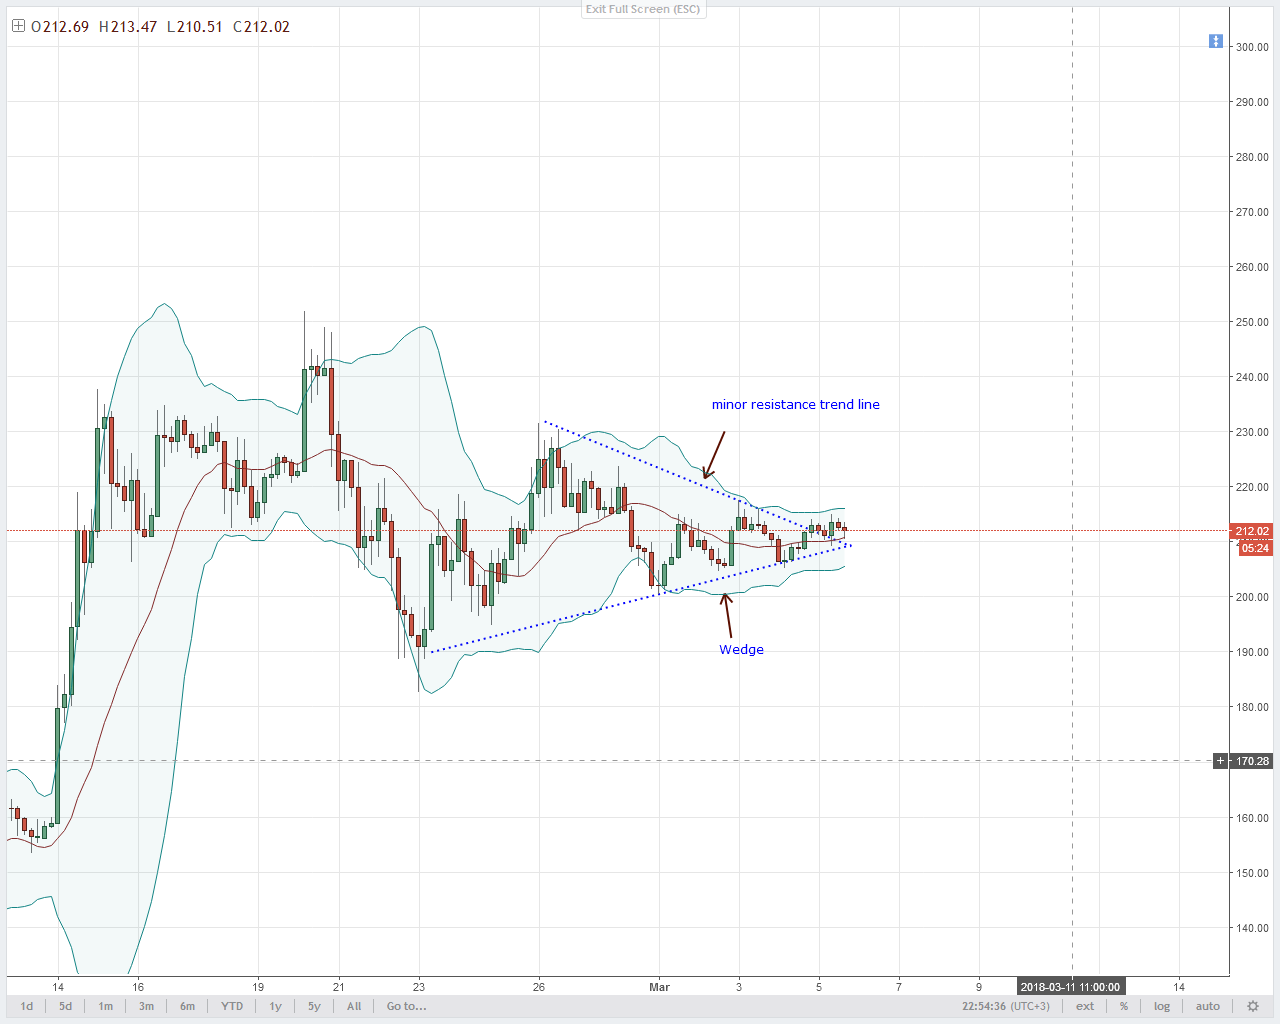
Even though the bulls cannot find the necessary momentum for a significant surge in prices, what is important for us is that LTC prices are rising above the triangle..
This could provide a solid foundation for buyers to go long with stops at $200, but we need confirmation of this breakout first. Therefore, $225-$230 could be a good indicator for buyers.
NEO/USD
One look at the four-hour time frame is enough to tell that NEO prices are falling and may fall below the support line.
I would only recommend placing short or long entries when prices exceed $140 or fall below $100. Until this point, I would remain neutral.
According to https://www.newsbtc.com

You May Also Like
ADA/USD analysis as of November 30, 2018
Cardano currency is good for its regular updates, which give a clear picture of the development process, which also affects the price. On the hourly chart we see a short-term bullish trend line with support at $0.0410.
Analysis of Stellar Lumen, Bitcoin Cash, EOS, and Litecoin as of November 30, 2018
Our review today opens with the XLM/USD pair. For the first time in its entire history, Stellar Lumen managed to surpass Bitcoin Cash in terms of capitalization and take an honorable fourth place according to CoinMarketCap.