
I bring to your attention another forecast of the dynamics of the exchange rate of the main cryptocurrency pairs
BTC/USD
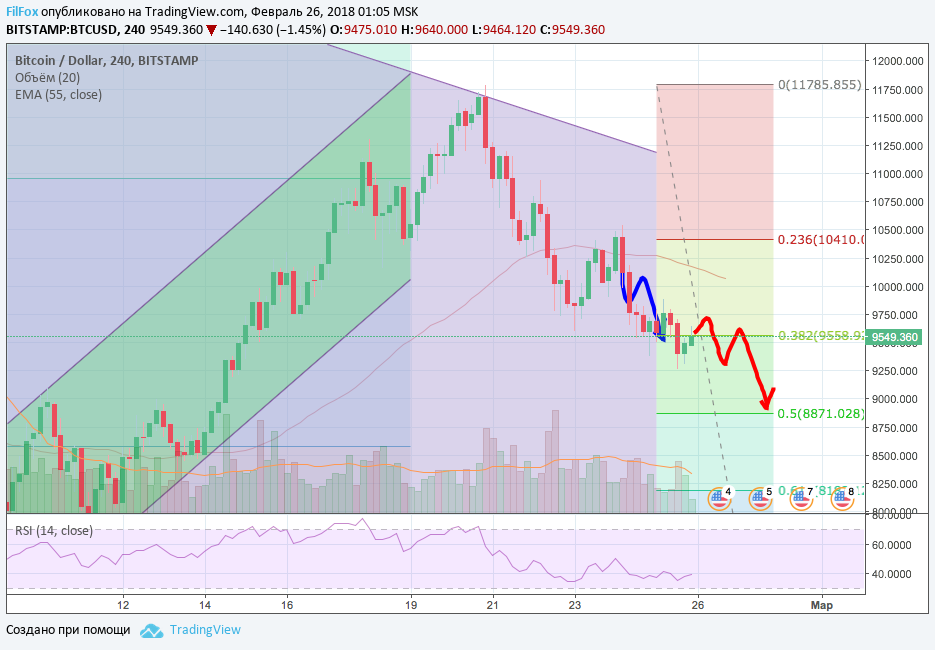
Analyzing the news background on Bitcoin, we can note its neutral nature. Two major cryptocurrency exchanges, CoinBase and BitFinex, have supported the use of the SegWit protocol. Earlier this was announced by the Bitcoin-Core wallet. It is believed that the implementation of this protocol will reduce commissions and increase the speed of processing Bitcoin transactions. Another major bank, Toronto-Dominion Bank, has limited the use of its credit cards for cryptocurrency exchange.
At the beginning of this week we expect a further decline in the Bitcoin rate to the support level of 50% fibonacci (8,871.00 USD). Before the price tests this support level, some consolidation is possible around the 38.2% fib (9,558.00 USD), but we believe that a rebound from this level is less likely than from the 50% fib.
ETH/USD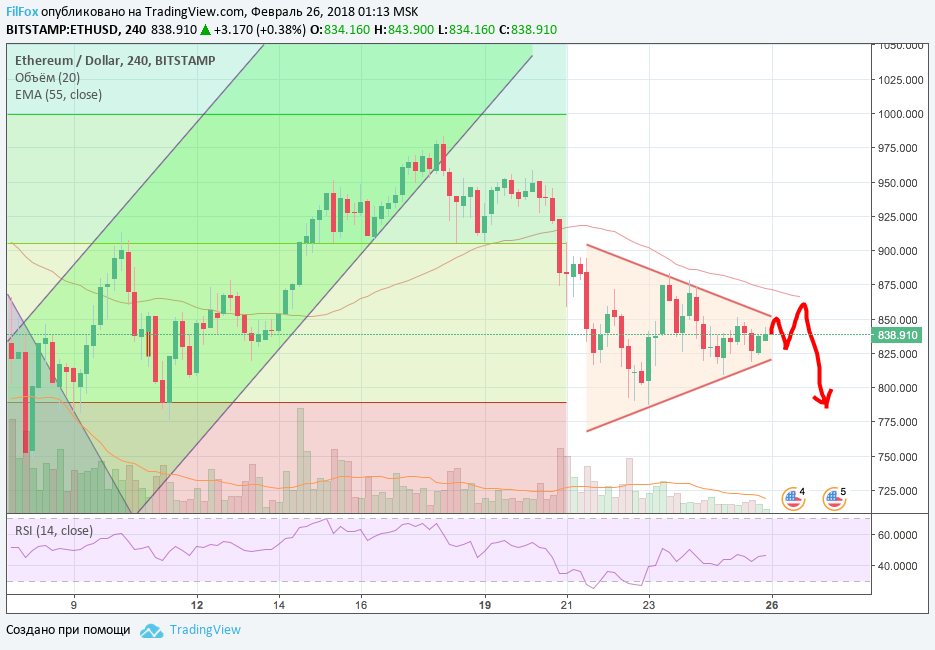
In the absence of positive price dynamics for Bitcoin, significant growth in altcoins will also be limited by the nearest resistance levels. For most cryptocurrencies, this level will be the EMA55 curve. We believe that at the beginning of the week the price of Ethereum will be in a sideways range, experiencing bearish pressure. With a strong impulse, a decline to the support level of 23.6% fib (788.00 USD) is possible.
XRP/USD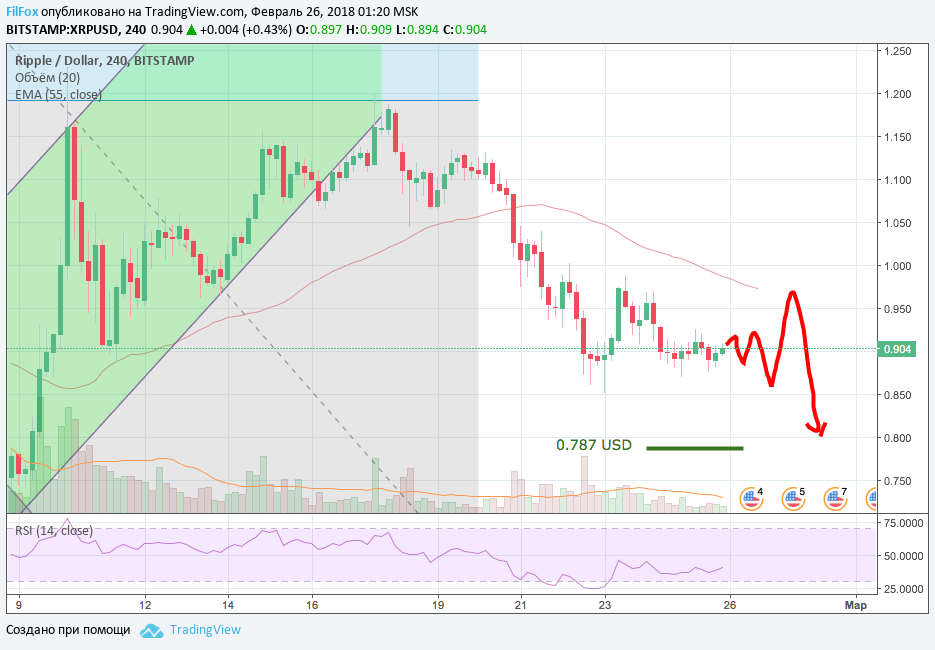
Most likely, the price of Ripple will also continue to move sideways, but perhaps increase the amplitude of the deviation from the equilibrium state, which the price found it at the level of 0.900 USD. Fundamental events can give positive dynamics to the price of Ripple, but the information that two more large international banks and two payment systems have joined the project of using the Ripple Net network in the field of international payments did not properly affect the increase in the cost of Ripple coins. We continue to monitor the news background. Subscribe to our Tradingview profile and never miss another review! https://ru.tradingview.com/u/FilFox/

You May Also Like
Analysis of Stellar Lumen, Bitcoin Cash, EOS, and Litecoin as of 12/13/2018
We assess the probability of continued price recovery to the target level
Analysis of cryptocurrency pairs BTC/USD, XRP/USD and ETH/USD as of December 28, 2018
The exit from the rectangle went in the direction of decline. Will the market be able to recover after overnight consolidation?