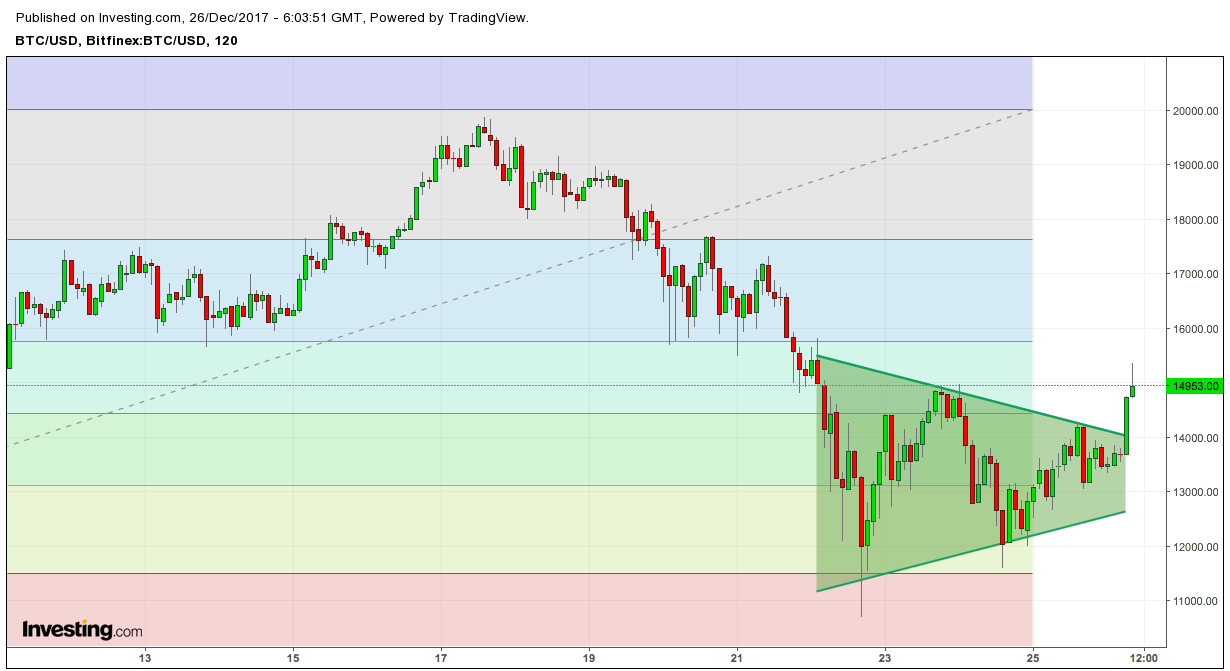
Exit flag pattern
BTC/USD
After consolidating in the “thirteen five hundred” area, the price completed the flag pattern. According to the classical theory of technical analysis, when the “flag” figure is completed, the flag border is tested and movement along the trend is resumed, and the strength of the breakout should correspond to the size of the flagpole. Thus, a breakdown of the upper border of the flag is expected to the price level of sixteen thousand, which approximately corresponds to 61.8% fibonacci. This green fib level should act as price support and a consolidation zone, after which the price will again be able to continue growing to the upper border of the blue zone (78.6% fib level - 17500.00). However, you should pay attention to the price level of 16200.00, in the blue Fibonacci rectangle. Around this value, the price repeatedly met support during trading last week, and on December 27, when the price moves upward, this level can provide quite strong resistance and overcoming it on the first try can return the price to $15,600.00 per bitcoin.

You May Also Like
Analysis of cryptocurrency pairs BTC/USD, XRP/USD and ETH/USD as of 12/03/2018
Over the weekend, the market traditionally did not show excessive activity and was in a predictable sideways range. In the near future, the dynamics of the sideways trend will continue
IMF: global debt has reached a record high, the apocalypse is approaching
Global debt hit another high of $247 trillion in the first quarter of 2018, according to a report released Wednesday. Of this figure, the non-financial sector accounted for $186 trillion, the International Monetary Fund (IMF) said.
