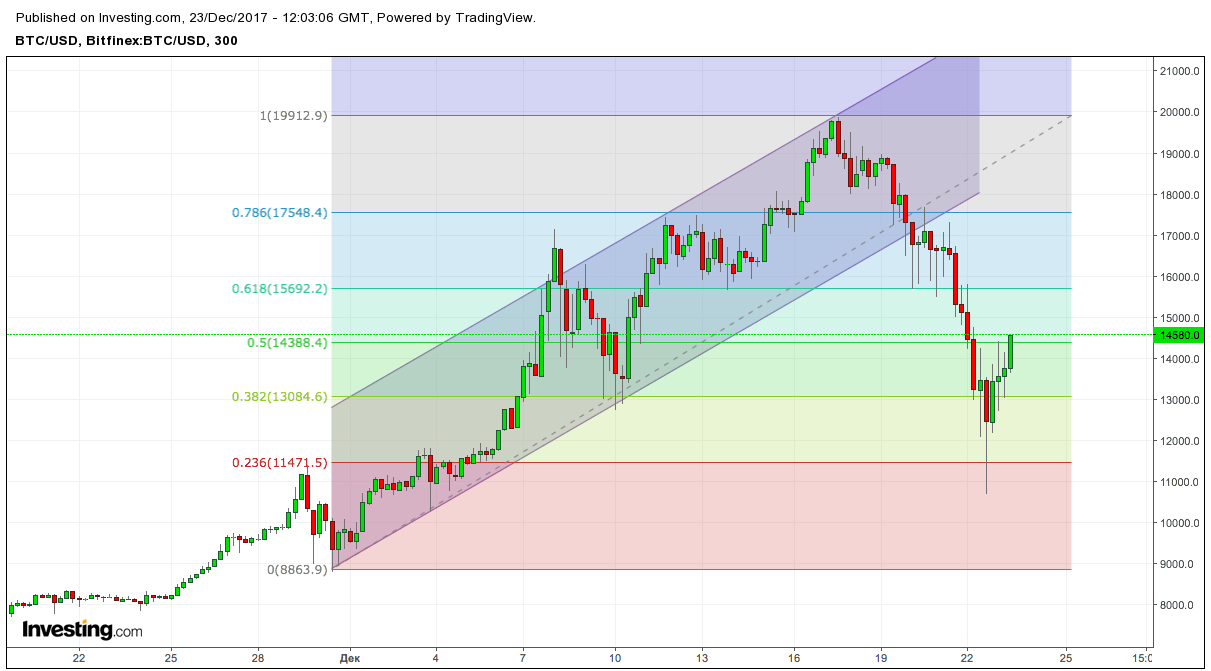
End of correction
BTC/USD
The prolonged and deep correction in the BTC/USD price, which began on December 17, created a panic among many traders, which was fueled by alarming publications of skeptical statements about the future of Bitcoin. Against this background, the price of Bitcoin set a minimum at 10718.00, breaking through the support level of 23.6% fibonacci. The Internet, for the umpteenth time, is full of headlines about the “soap bubble”. However, at the height of the excitement, the price completed the correction (40%) and resumed growth. We already had the pleasure of observing a correction of similar depth from September 8 to September 15, 2017, when the price sank by 36%. Forecasts for the price of BTC/USD for the next week have not changed, and still remain in the range of the gray corridor around the nineteen thousand area.

You May Also Like
Analysis of cryptocurrency pairs BTC/USD, XRP/USD and ETH/USD as of November 23, 2018
Will there be a break below key support levels? What is the likelihood of a correction from current levels?
Analysis of Stellar Lumen, Bitcoin Cash, EOS, and Litecoin as of 12/06/2018
This morning, bearish momentum pushed prices to new lows. The price recovery may not last long; the decline will soon continue.
