
Today, the dynamics of cryptocurrency pairs will have a sideways trend with a gradual decrease in price
BTC/USD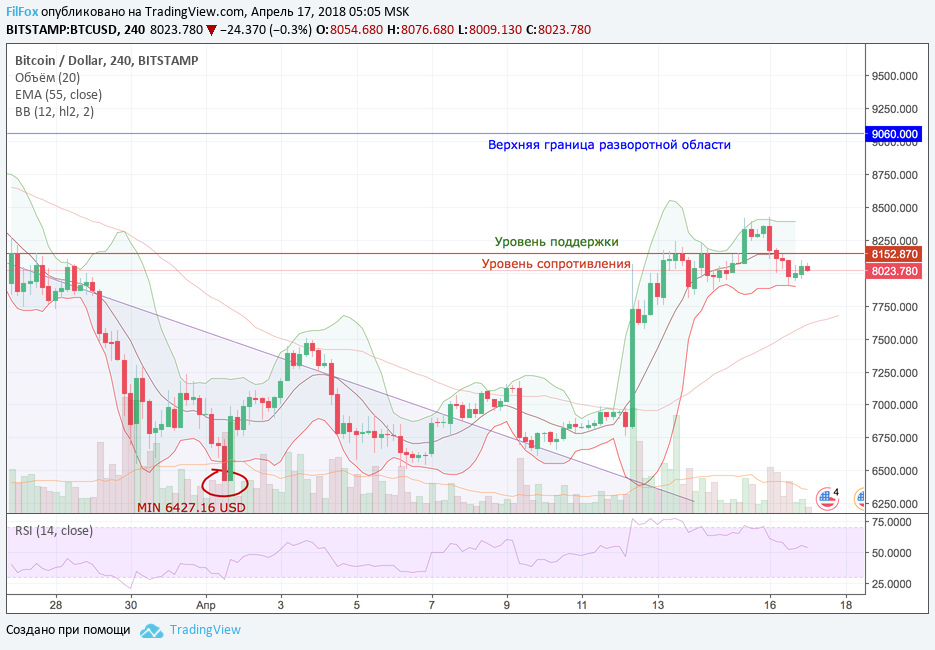
Over the past 24 hours, the Bitcoin price has consolidated below the resistance level of 8,152.87 USD. On a four-hour time frame, the average line BB (Bollinger Band) passes through this level, and the BTC price chart beats in the range between the average and lower line of the Bollinger Bands.
We believe that today, further consolidation will continue in this range, with a gradual decrease in price to the level of the moving average EMA55, which is located in the price area of 7700.00 USD.
A breakout of the upper limit of this range is possible, since the RSI indicator has already left the overbought zone and is in the neutral zone, near the 50% level. However, we believe that such a breakdown is unlikely, since previous purchases took place on very small volumes and, most likely, this feature will continue today.
ETH/USD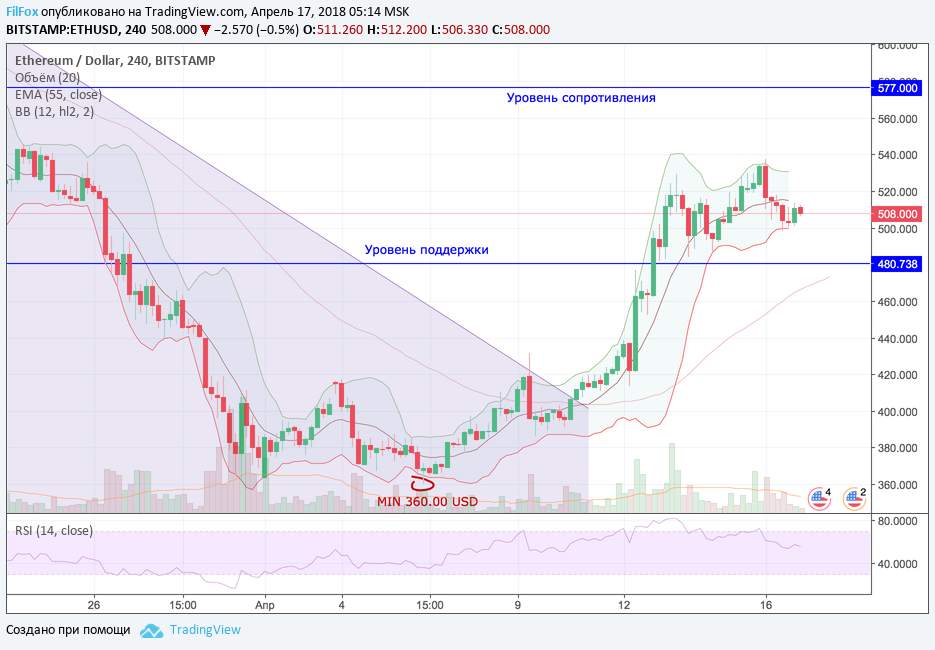
Ethereum yesterday consolidated under the average BB (Bollinger Band), which on a four-hour time frame is at the level of 512.00 USD. Today, consolidation will continue, gradually decreasing towards the support level of 480.00 USD.
XRP/USD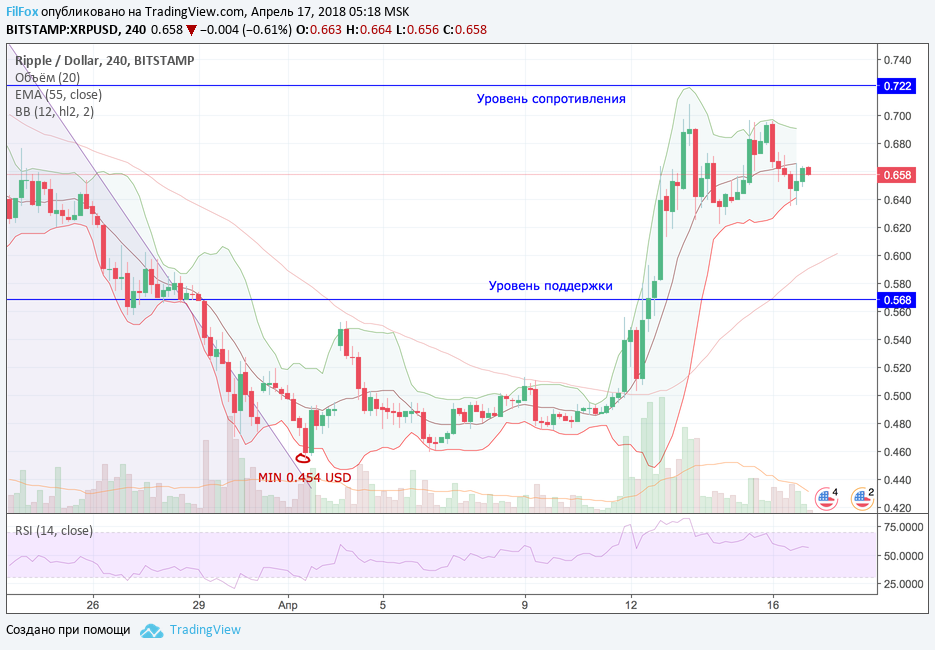
Ripple fell all day yesterday until it set the daily low at 0.635 USD. After this, the price recovered to the level of the middle line of the Bolinger Bands (0.666 USD). Today, the consolidation will continue and as the price declines, it will again test the lower boundary of the BB (Bollinger Band).
Subscribe to our Tradingview profile and never miss another review! https://ru.tradingview.com/u/FilFox/
* All price values are based on data from the BitStamp exchange

You May Also Like
Price analysis of Bitcoin, Ethereum, Ripple on 12/09/2020
Yesterday, bearish momentum pushed the market out of a sideways narrowing range. Will buyers be able to recover to the average price area?
Analysis of TRX and IOT as of 11/23/2018
Bitcoin-altcoin trading pairs are the reason why the value of altcoins depends on the price movements of Bitcoin. At the moment, the price action is bearish, so altcoins continue to fall.