
Buyers yesterday were unable to restore the market above the average price level. Will they be able to withstand the bearish onslaught today?
BTC/USD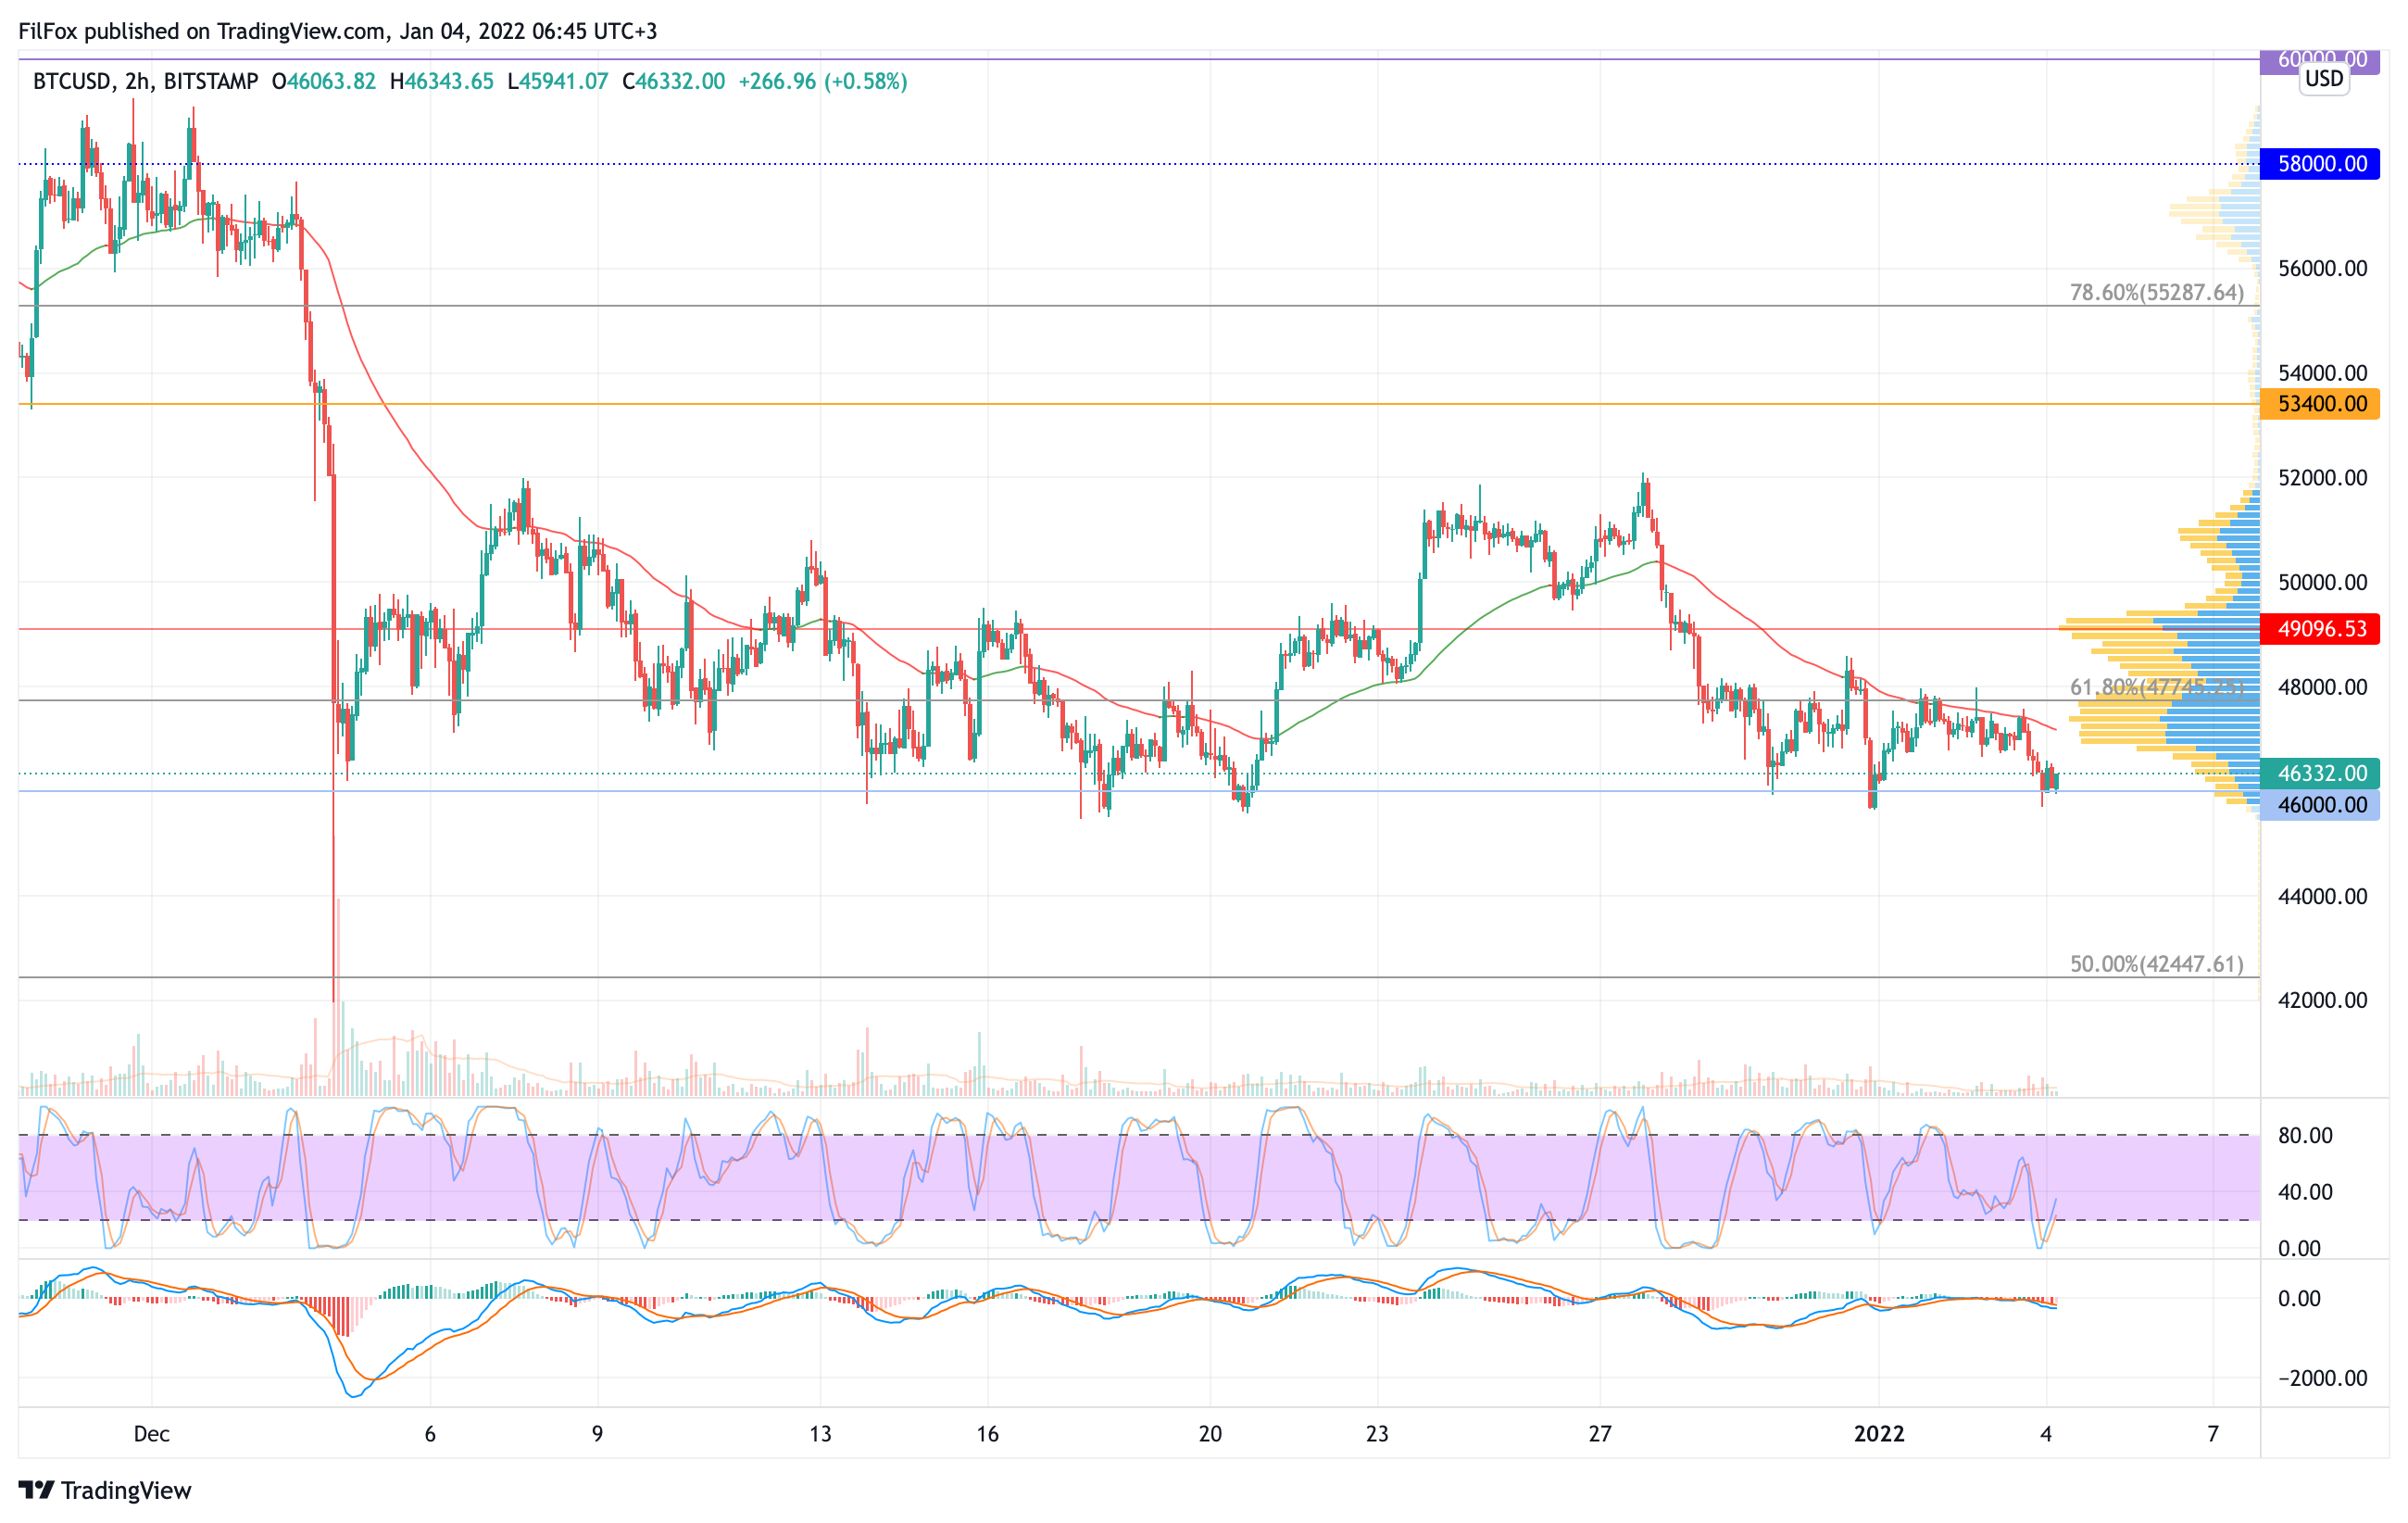
Yesterday, the BTC price was unable to overcome the resistance of the two-hour EMA55 and again rolled back to the support of 46000.00 USD.
Tonight the price tested the area of December lows, but until the morning it remained above forty-six thousand dollars.
Increasing bearish pressure and breaking through blue support will lead to the implementation of our negative scenario, in which the Bitcoin price will roll back to the 50% fib level (42447.61 USD).
ETH/USD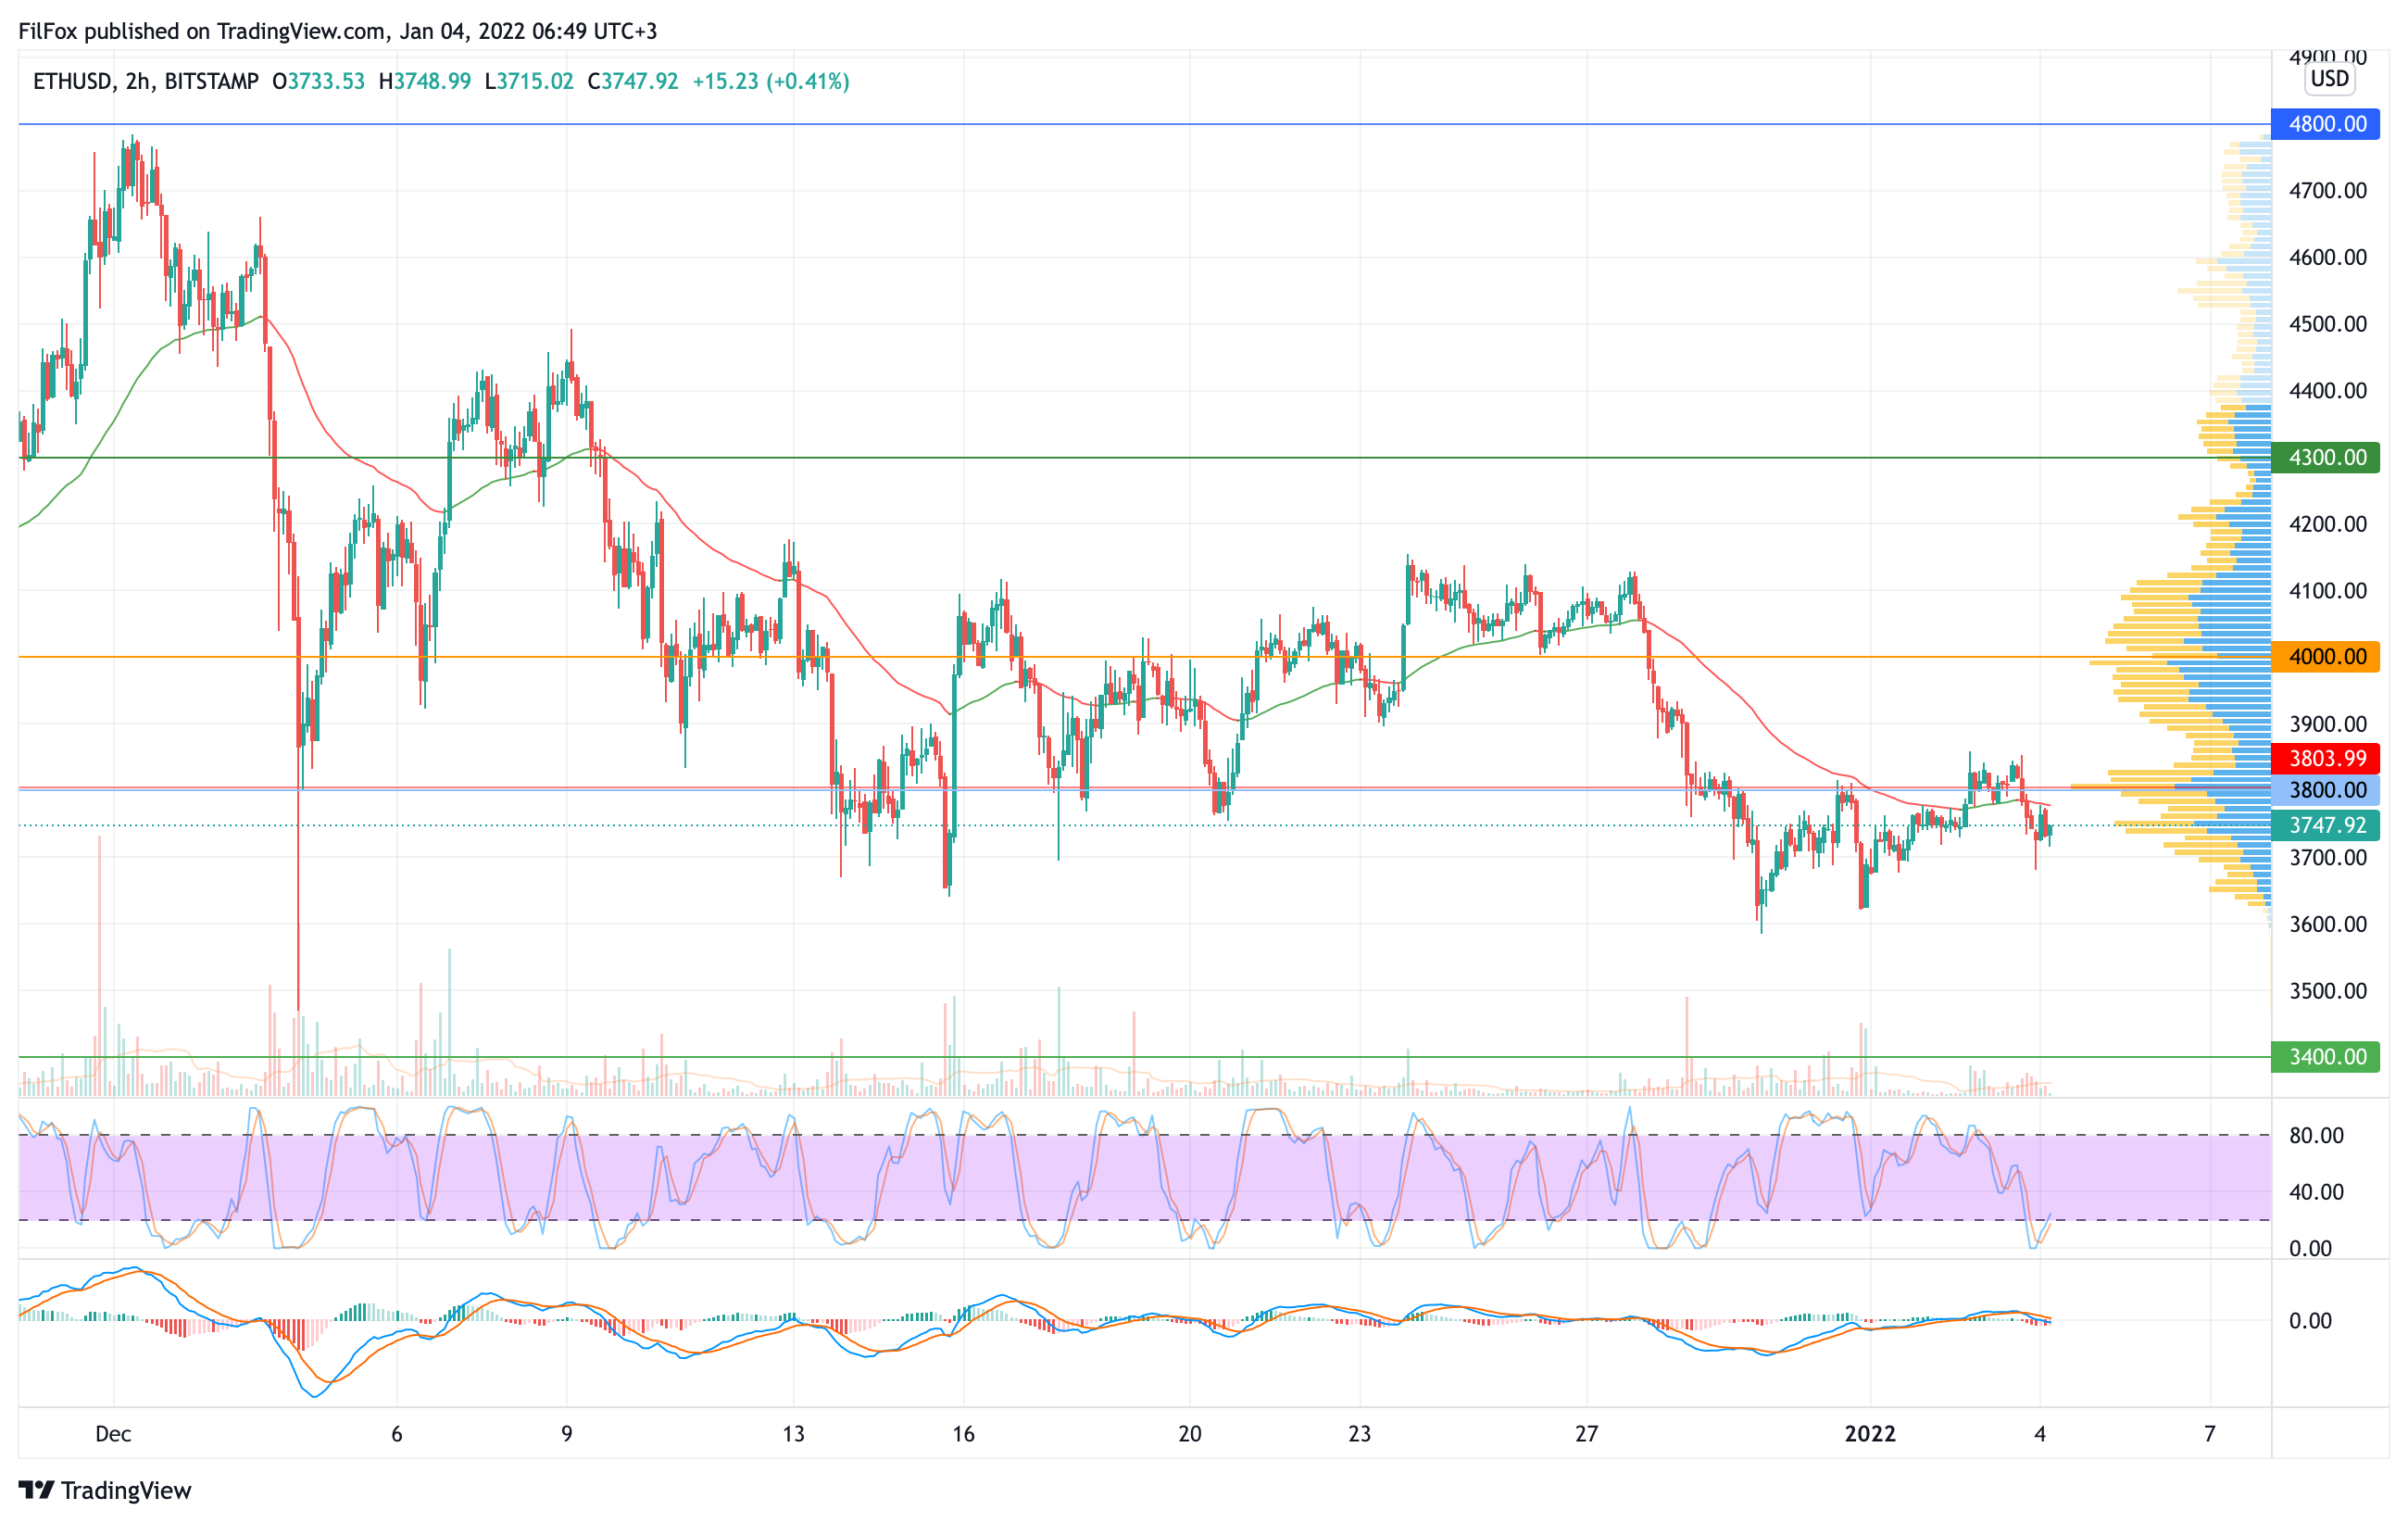
Yesterday afternoon, sellers dominated the market. They broke through the support of the two-hour EMA55 and tested the level of 3700.00 USD.
If today during the day buyers are unable to return the pair above the level of average prices, then the decline will continue to the area of 3600.00 USD, and in the near future will reach the support of 3400.00 USD.
XRP/USD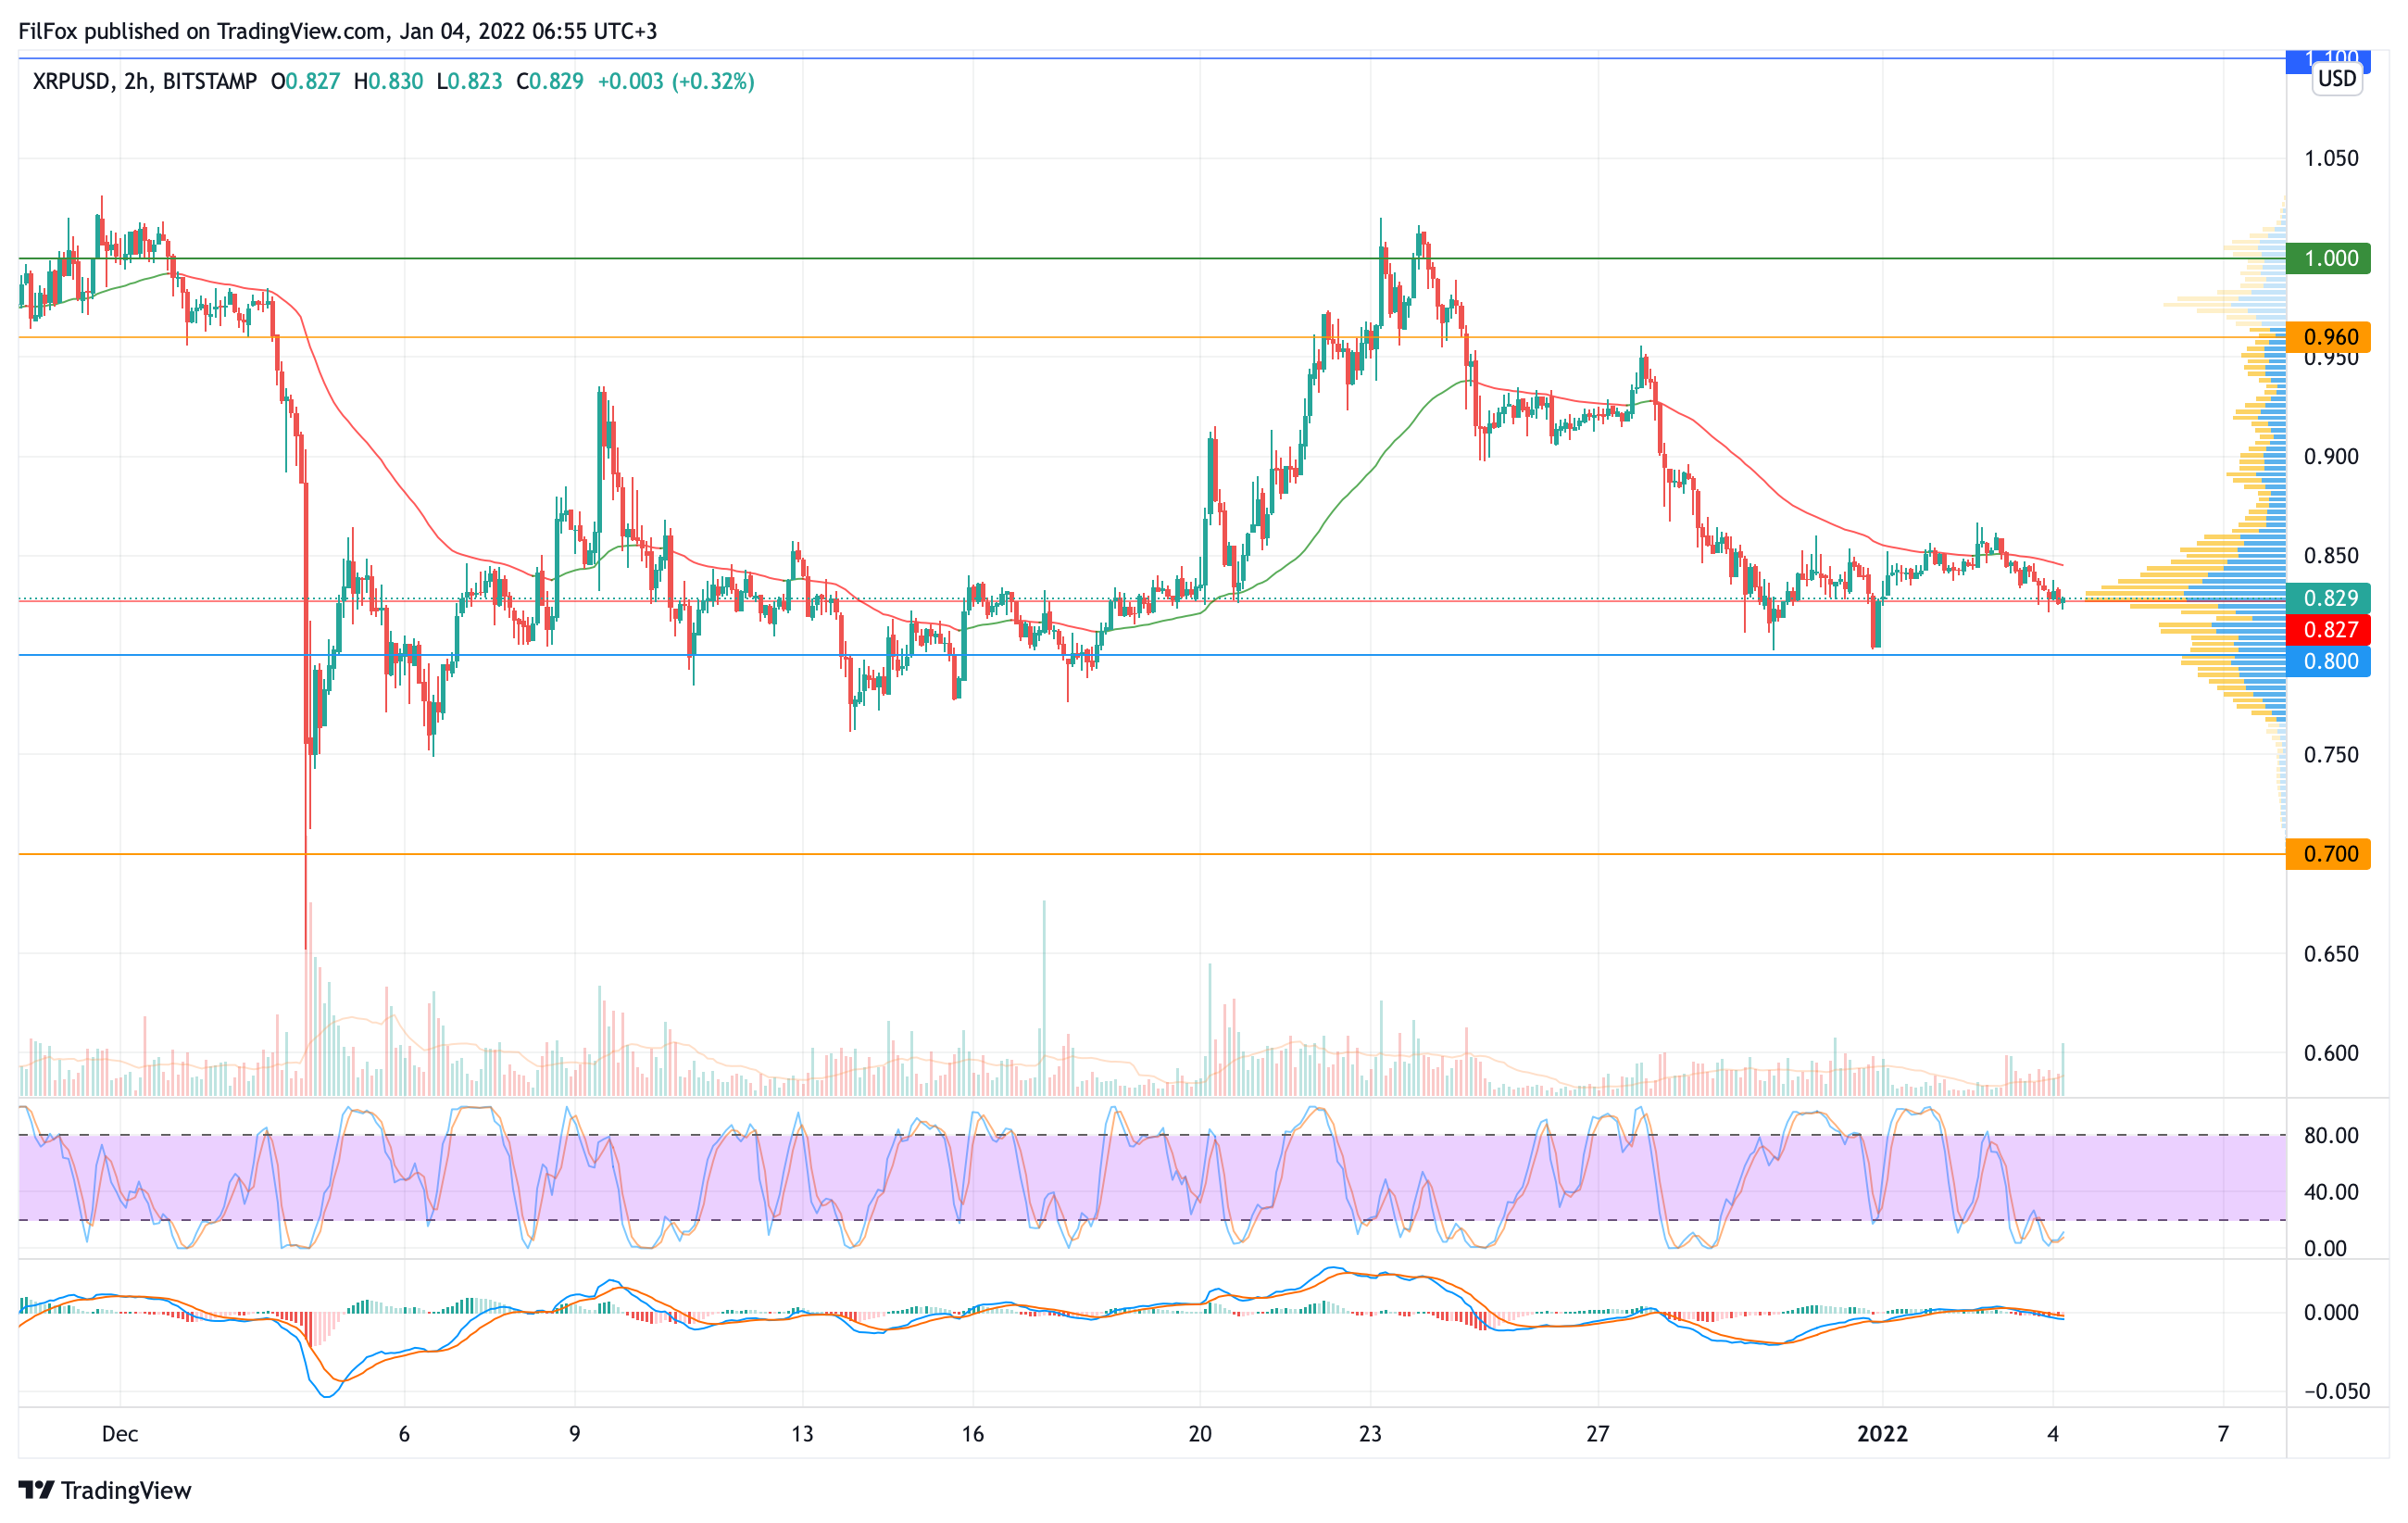
Yesterday morning, buyers were unable to restore the XRP price above the two-hour EMA55. Despite pressure from sellers, the pair was able to stay on the POC line (0.828 USD).
However, if the bearish pressure intensifies today, they will roll back the Ripple price to the support of 0.800 USD.
*All price values are based on data from the BitStamp exchange
Subscribe to ForkNews in Telegram

You May Also Like
ADA/USD analysis as of November 30, 2018
Cardano currency is good for its regular updates, which give a clear picture of the development process, which also affects the price. On the hourly chart we see a short-term bullish trend line with support at $0.0410.
Market overview of the main cryptocurrency pairs for the current week (from 11/19/2018 to 11/25/2018)
In today's review, as always, we summarize the results of the outgoing week and analyze the overall price dynamics