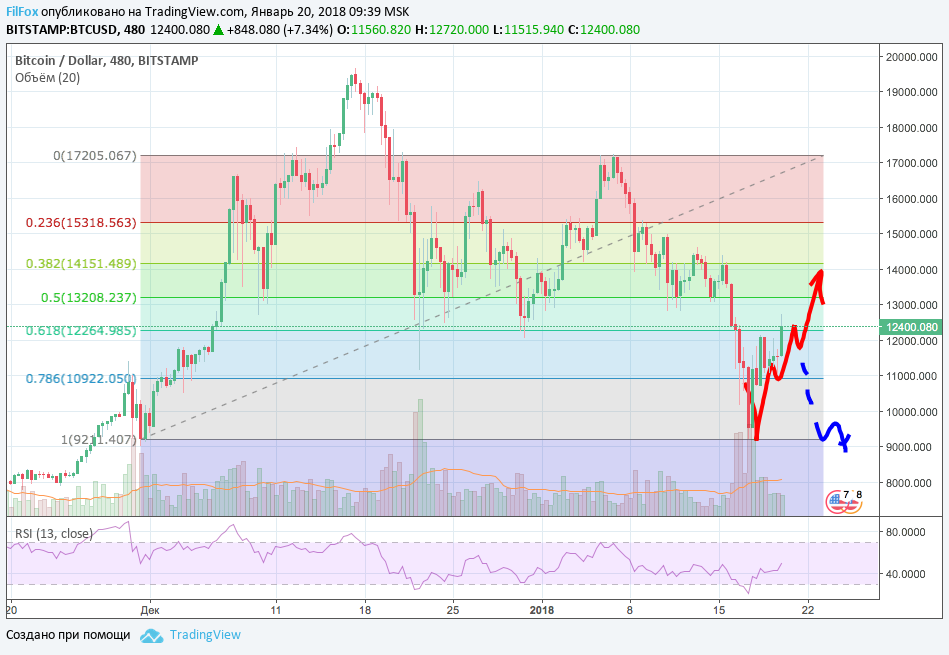
I’m publishing yesterday’s forecast chart for the BTC/USD pair and monitoring its execution.
As can be seen from the BTC/USD chart, the price recovered to the 61.8% fib level, to the area of 12,264.00 USD per Bitcoin, and managed to break through this resistance level. If it manages to gain a foothold above the 61.8% fib, then there is a very high probability of growth to the area of 13,500.00 USD, and as I mentioned yesterday, this means a change in the downward trend. A repeat retest of the low zone (indicated in blue) is less likely.

You May Also Like
Price analysis of Bitcoin, Ethereum, XRP on 09.23.2021
Yesterday the market showed signs of recovery. Will the bulls be able to continue rising today?
Analysis and forecast for Bitcoin for the period from August 8 to August 13
Analysis and forecast of the Bitcoin picture for the period from August 8 to August 13 from the Kick Ecosystem analyst team.
