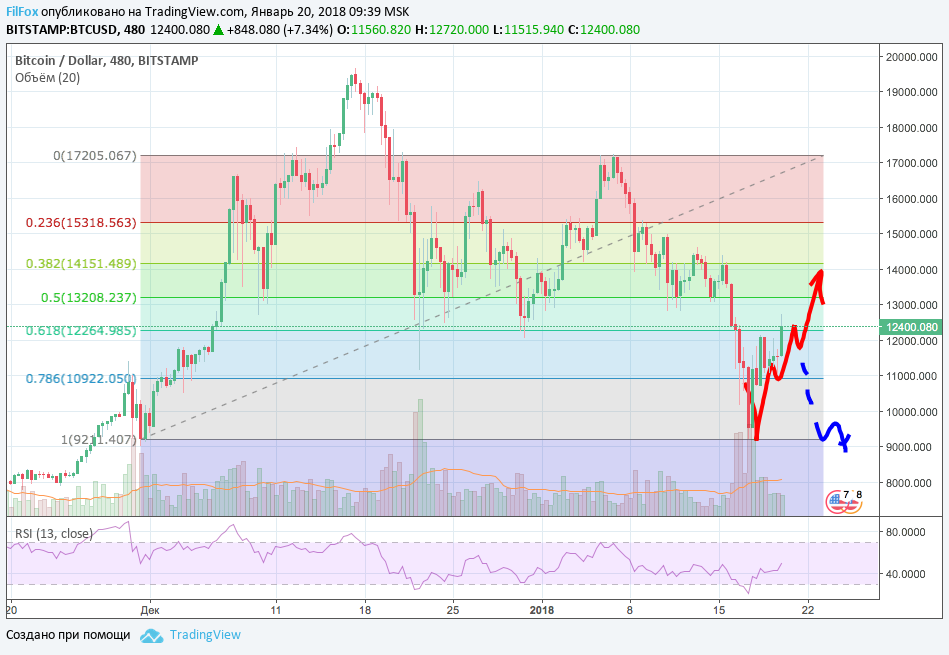
I’m publishing yesterday’s forecast chart for the BTC/USD pair and monitoring its execution.
As can be seen from the BTC/USD chart, the price recovered to the 61.8% fib level, to the area of 12,264.00 USD per Bitcoin, and managed to break through this resistance level. If it manages to gain a foothold above the 61.8% fib, then there is a very high probability of growth to the area of 13,500.00 USD, and as I mentioned yesterday, this means a change in the downward trend. A repeat retest of the low zone (indicated in blue) is less likely.

You May Also Like
Analysis of cryptocurrency pairs BTC/USD, XRP/USD and ETH/USD as of November 24, 2018
The intense decline slowed down slightly towards the end of this week. Market activity is expected to be low this weekend. Pairs will continue to consolidate near key support levels
Analysis of Bitcoin Cash, Stellar Lumen, EOS and Litecoin as of November 23, 2018
Today the price has emerged from yesterday’s consolidation and some altcoins even managed to update their lows. But we believe that after the end of the corrective recovery, prices will continue the sideways trend.
