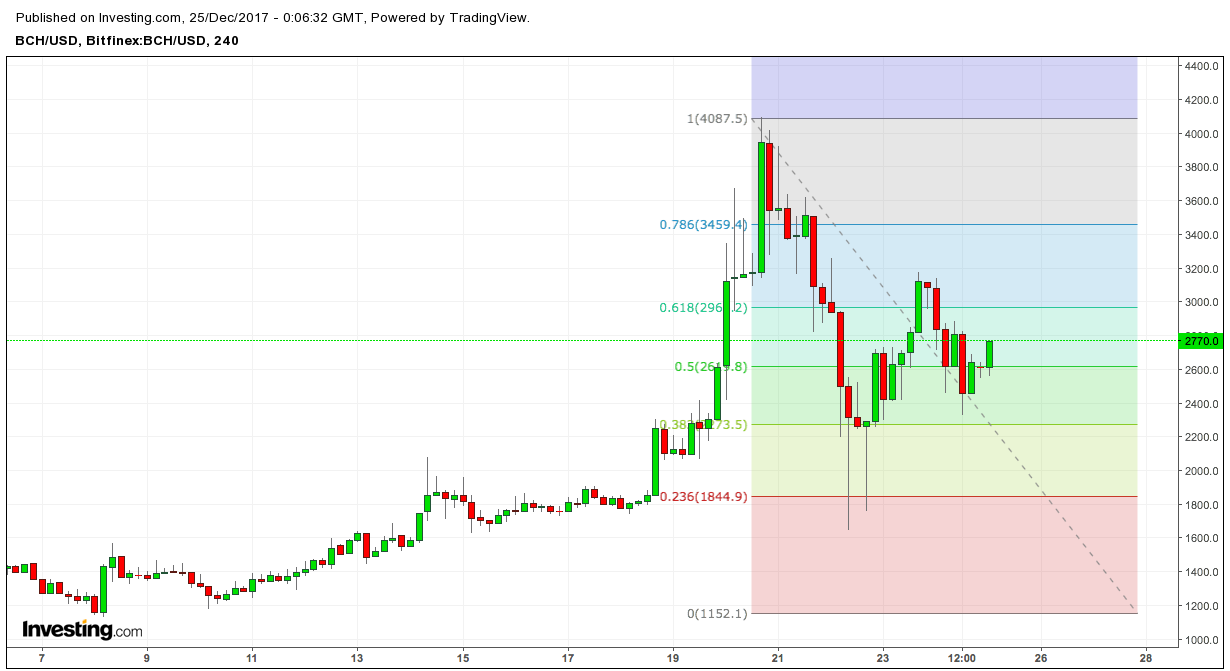
While the price of Bitcoin is struggling for lost positions and is trying, on the second attempt, to get out of a protracted correction, I propose to analyze the price chart of Bitcoin Cash
BTC/USD
The first block of this cryptocurrency was mined on 08/01/2017 as a result of the Bitcoin (BTC) hard fork. The new alt-coin, which was called Bitcoin Cash (BCN), had a block size of 8 MB and was conceived to solve problems associated with “scaling” settlements on the network - increasing the speed of settlements and reducing the cost of transactions. Along with these advantages, there were threats associated with the decentralization of the entire system. A more detailed analysis of the advantages and disadvantages was published by Forbes in an article by Blockchain Capital Managing Director Spencer Bogart.
The struggle between BTC and BCH for the palm in the cryptocurrency rankings intensified after Bitcoin Cash PR managers published a number of interviews in which they expressed negative forecasts about the future of Bitcoin and the high risks associated with investing in it. The publication dates are associated with the beginning of the fall in the price of BTC, after reaching a maximum of twenty thousand, and with the increase in the capitalization of BCH. This indirectly confirmed the transfer of a fairly large part from BTC to BCH.
The BCH/USD price chart shows how the rush demand for Bitcoin Cash inflated the price by almost 55%, from 1800.00 to 4000.00 US dollars, at the same time the price of Bitcoin decreased from twenty to thirteen thousand.
We see that the cryptocurrency market is very sensitive to fundamental events, due to the fact that a large volume of assets is concentrated in a rather narrow circle of investors. According to various estimates, this volume reaches 70-80% of the total market. Therefore, the behind-the-scenes struggle of “clans” for a place in the sun can raise a “wave” that can easily be mistaken for a trend reversal.

You May Also Like
Analysis of Stellar Lumen, EOS, Litecoin and Bitcoin Cash as of 12/17/2018
Over the weekend, altcoins were mostly in a sideways range. But now, after a short recovery, the downtrend may resume
Analysis of cryptocurrency pairs BTC/USD, XRP/USD and ETH/USD as of December 17, 2018
Last Sunday, bearish pressure eased significantly. However, it is not yet possible to overcome the nearest resistance levels. Will new attempts to restore the market be successful today?
