
Let's try to predict the depth of the correction for Bitcoin and Ethereum.
ETH/USD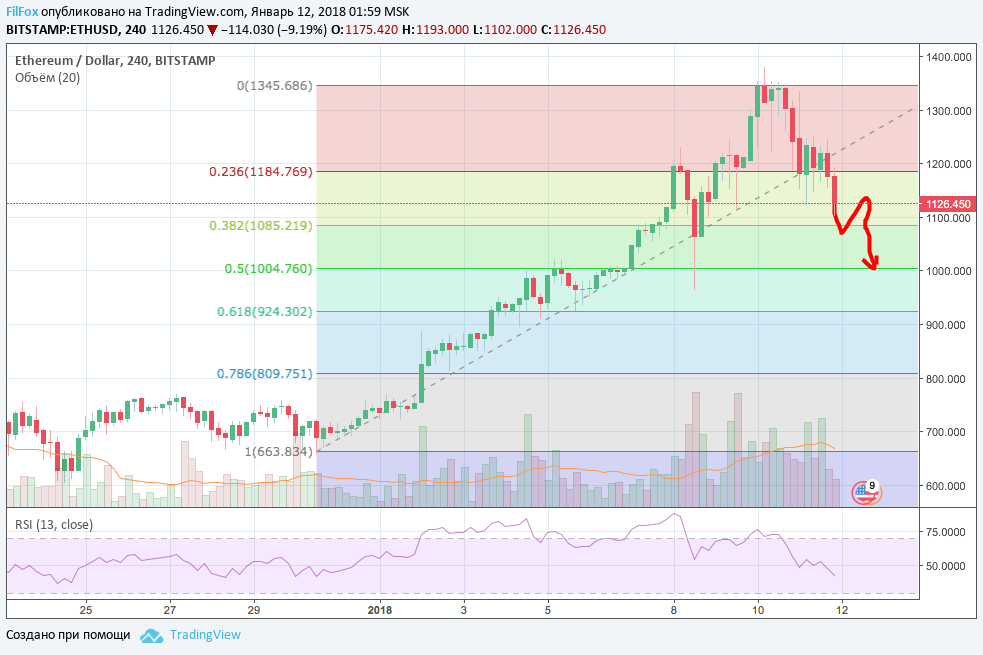 

Let's look at the Ethereum price chart and try to analyze what we should expect from the price on January 12.
So, on January 10, Ethereum marked its absolute maximum at 1378.99 USD (this value according to the BitStamp exchange)
The RSI indicator (relative strength index) was slightly above the 75% mark, so it is not yet possible to talk about the market being overbought. Moreover, after the price correction (January 11) to the 23.6% fibonacci level, the RSI indicator returned to the neutral zone below the 50% level, signaling the start of sales. Therefore, from the 23.6% fibo level, the price may continue to correct to the next support level of 38.2%
According to the Transaction Volume Indicator: we can say that the maximum price is set at average volumes. And the price decline to the level of 1200.00 USD occurred on approximately the same volumes.
Thus, on January 12, the probability of a price decrease to the support level of 1085.00 USD is more likely than a price increase to a new high at 1400.00 USD. It should be noted that the correction in the one thousand one hundred area may drag on to the psychological level of 1000.00 USD per ether. The price chart shows that the ETH/USD pair has consolidated in this price area several times. So a retest of this level is also very likely.
BTC/USD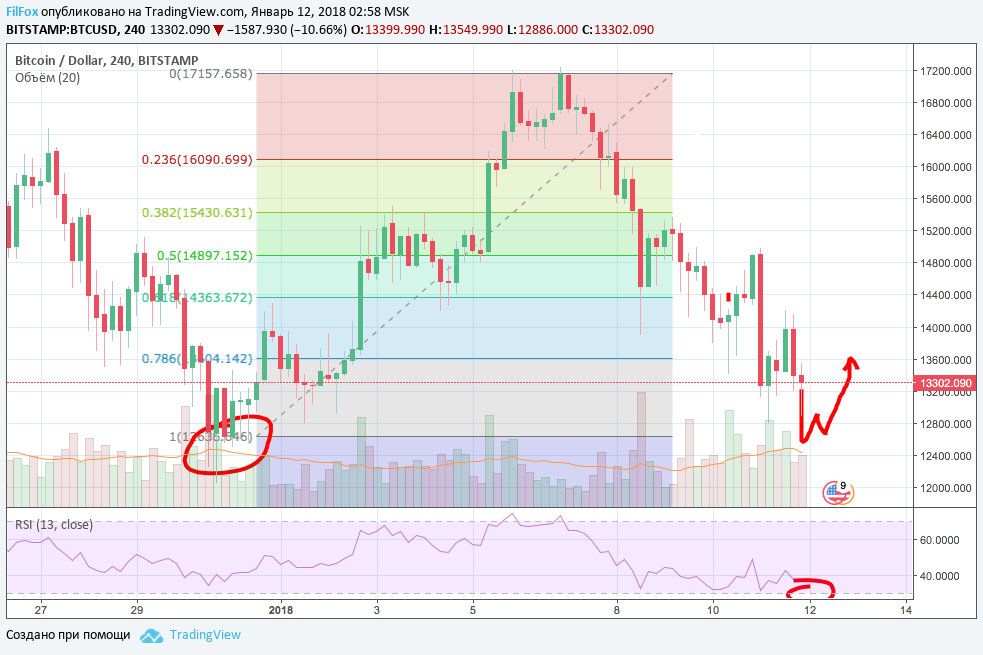
Bitcoin on January 11 reversed its recovery to the fifteen thousand zone and we witnessed sales in medium volumes. However, this led not only to a price drop to the support level of 78.6% fibonacci (13600.00USD), but also to its breakdown with a local minimum at 12800.00 USD. During the day, the price tried several times to recover above the 78.6% fibo, but in the end the day closed below this level, around 13400.00 USD.
Judging by the RSI indicator, which is still in the neutral zone (just below 50%), sales will continue on January 12, which will lead to a further drop in the price to the level of 12600.00 USD. This is the zone of lows to which the price had already dropped at the end of last year, on December 30. Here you need to pay attention to the indicator of relative strength: if it signals that the market is oversold (this is approximately an area around 5-7%), then most likely the “One Hundred Percent Fibonacci Level” will support the price and it will begin to recover.

You May Also Like
Analysis of cryptocurrency pairs BTC/USD, XRP/USD and ETH/USD as of November 26, 2018
Last week's weekend was not a quiet one. On Sunday, the market was expecting a new wave of decline, after which prices managed to recover slightly. Will the correction continue today?
Bitcoin, Ethereum, XRP price analysis as of 02/22/2021
At the end of last week, the Bitcoin price updated its absolute maximum above the level of 58,000.00 USD.