
The price of Bitcoin Cash did not show growth for a long time and fell below $700. There are two bearish trend lines, located at $750 and $850 on the hourly time frame. Prices may continue to fall; BCH could soon trade at $600
BCH price decline
(editor's note: Just yesterday we watched as yet another cryptocurrency exchange excluded trading pairs with Bitcoin Cash from listing and thought about the reasons for what was happening. As always, there were bears here.)
Due to increased selling pressure, prices broke through the support line at $750 and settled below $700. The minimum was reached at $679, and a small correction began from there. At the moment, prices are well below the $750 mark.
We see many signs of bearish pressure on the charts. Initial resistance is at the 23.6% fibonacci level built on the last price decline from $898 to $679. Most importantly, there are two bearish trend lines on the hourly time frame at $750 and $850. The first trend line is very important, it is located at the 50% fibonacci level.
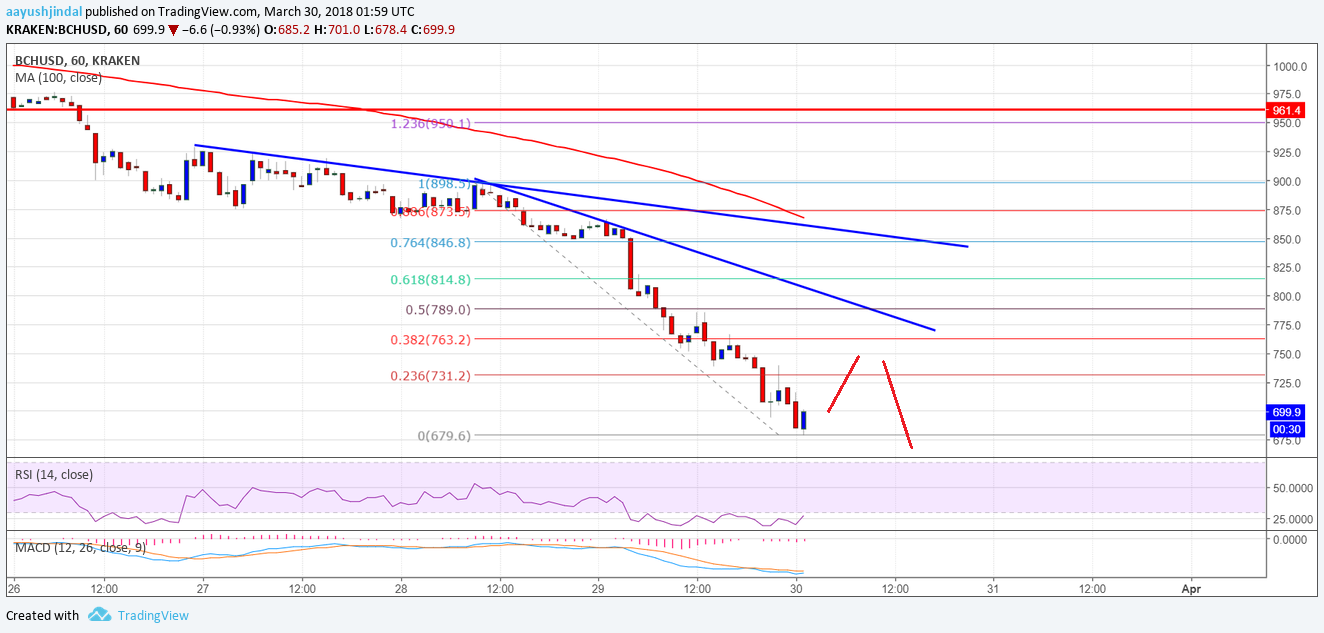
Thus, any increase in price will most likely be limited to $720 and $750. On the other hand, prices may fall below $650.
Technical indicators used:
MACD indicator shows bearish trend direction.
Relative Strength Index (RSI) - 30
Major support level - $650
Major resistance level - $750.
According to https://www.newsbtc.com

You May Also Like
Market overview of the main cryptocurrency pairs for the current week (from 11/26/2018 to 12/02/2018)
In today's review, as always, we summarize the results of the outgoing week and analyze the overall price dynamics
Despite poor macro statistics, Bitcoin is showing good signs of growth
KickEX traders analyzed the main events of the past week on the cryptocurrency market and gave a forecast for the BTC exchange rate for the new period.