The outgoing trading week began with a gradual decline in prices for all major cryptocurrency pairs. On Thursday, February 1, the rate of price decline increased, as a result of which the total capitalization of all cryptocurrencies decreased per day by 100 billion US dollars
During the incomplete working week, the total volume of cryptocurrency capitalization decreased by $240 billion, from $597 billion that were in assets on Monday, against 357 billion on Thursday. Over Friday and Saturday, when the price managed to consolidate a little, capitalization was able to recover to the level of $450 billion.
BTC/USD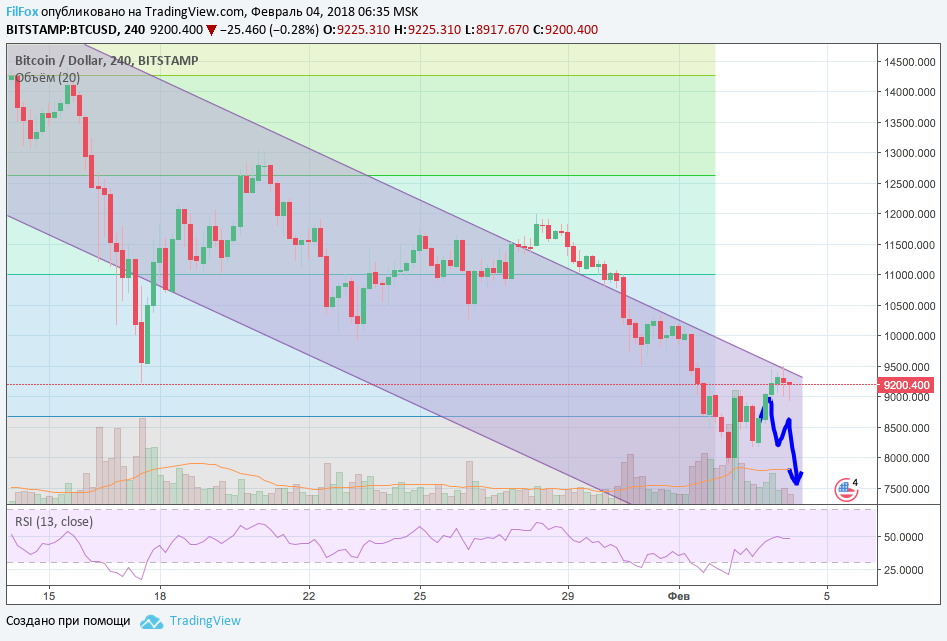
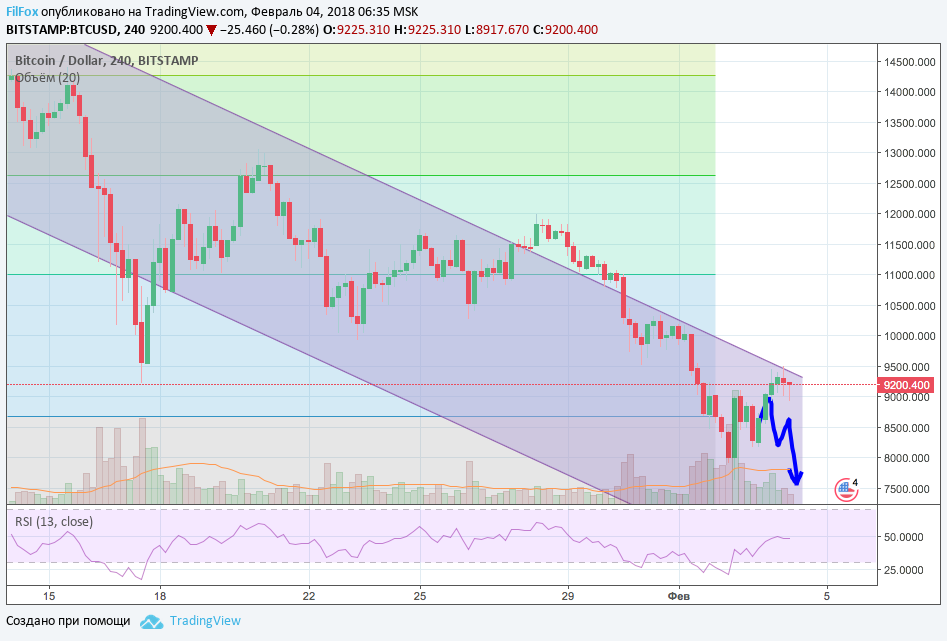
On February 2, the price reached a yearly minimum of 7910.00 USD, after which Bitcoin began to be bought back in fairly large volumes, as a result the price managed to recover slightly. On Saturday, the price set a maximum at 9491.00 USD, testing the upper limit of the downward channel, but then returned to the nine thousand area. I believe that the price has not yet reached the target level of reduction necessary to fill the investment portfolio of large market players, so at the beginning of the coming week we will still watch the pair decline to the area of 7100.00 USD into the “comfortable buying” zone. Perhaps it is at this level that the price will be able to reverse and change the trend to an upward one.
ETH/USD 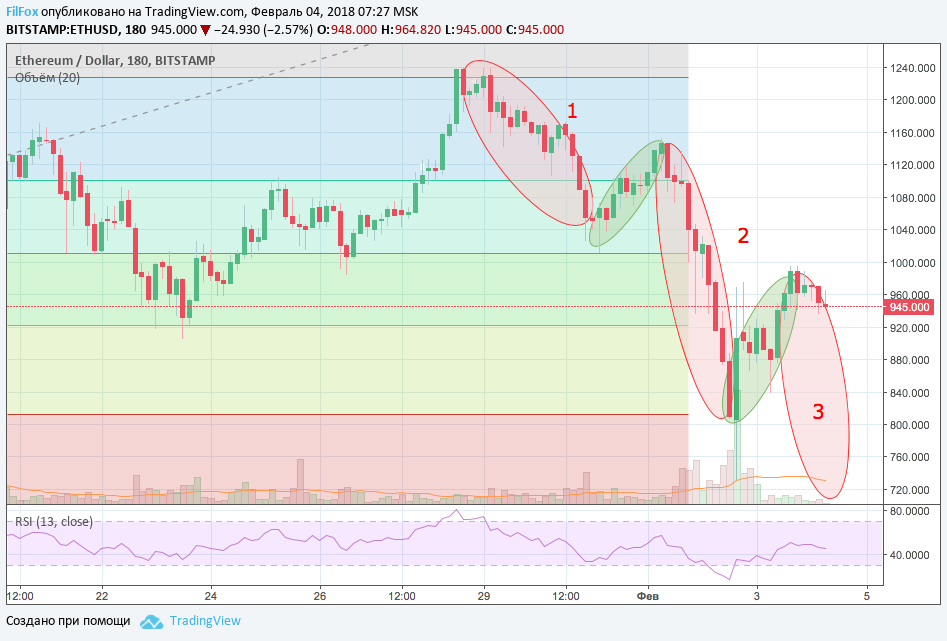
Ethereum last week, being under bearish pressure, drew two impulse and two corrective Eliot waves. On Saturday, an entry into the third impulse wave formed, which should last below the low of the second impulse wave, approximately in the price area of 720.00 dollars per ether. Please note that when the minimum was reached in the second impulse wave, there was a surge in purchases in huge volumes. The same thing awaits us at the end of the third impulse wave. Let's not miss the chance to buy ether, which has fallen in price by 40%.
XRP/USD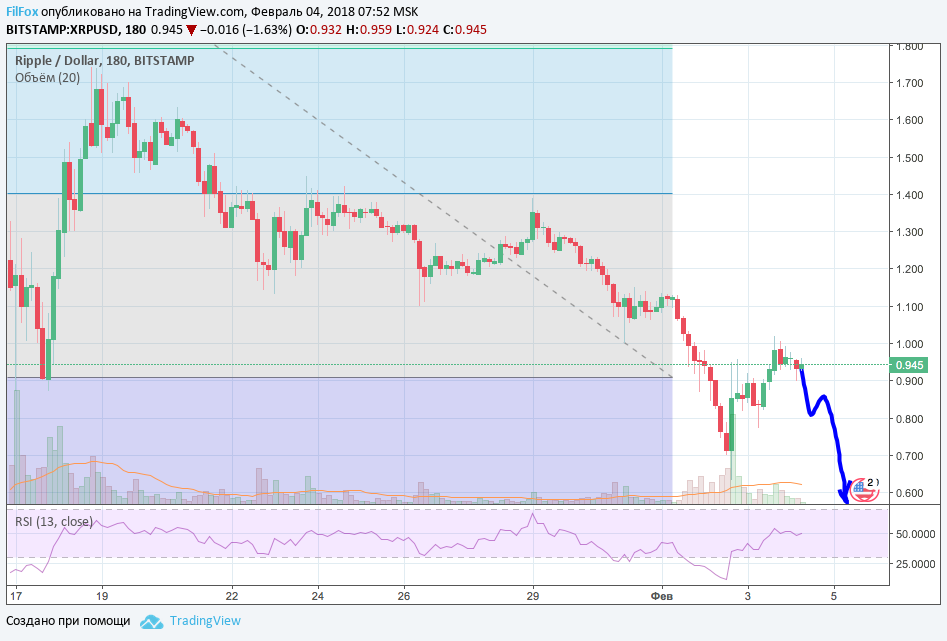
Ripple last week set the yearly minimum at 63 cents per coin. Quite a lot of buyers wanted to buy Ripple at such a “lucky” price. As a result, the price recovered to the psychological level of 1 US dollar. It looks like the next impulse wave will bring the price of this crypto asset down to 55 cents per Ripple.

You May Also Like
Bitcoin, Ethereum, XRP price analysis for 07/19/2021
At the end of last week, buyers tried to get out of the downward channel, but so far they have not been able to gain a foothold above the average price level. Can the bulls try again this week?
Analysis of Stellar Lumen, Bitcoin Cash, EOS, and Litecoin as of 12/10/2018
Despite the current decline, the market recovery phase has not yet ended. We determine the nearest resistance levels for correction.
