
In today's review, as always, we summarize the results of the outgoing week and analyze the overall price dynamics
BTC/USD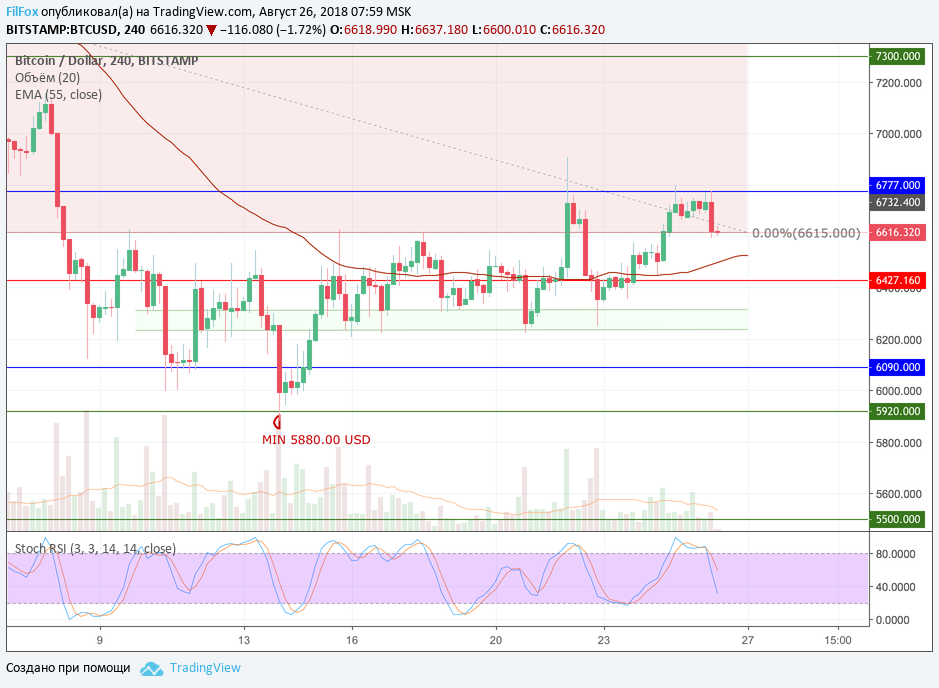
This week was dominated by the excitement surrounding the SEC's decision on ETF applications. According to most analysts, the event should have served as a driver for the market to exit the sideways corridor that has been ongoing since August 8. However, given the sad statistics on SEC refusals, the market was already prepared for fundamental negativity and late in the evening, August 22, reacted with a decline within the flat corridor. The day before, they tried to pump the Bitcoin rate and the price, having broken through the upper limit of the range, set a maximum at 6906.00 USD. Very quickly the pair returned to the previous level of 6427.16 USD, and then sank into the green support zone on news about the ETF.
The subsequent statement of the Securities and Exchange Commission (SEC), about a possible revision of its decision on ETF applications, slightly weakened the negative information field and the BTC/USD pair has already been able to test the resistance of 6777.00 USD several times, but overcome this level by decreasing volumes are not yet possible. Tonight, after another unsuccessful breakout, the price rolled back to the zero fibonacci level of 6615.00 USD.
Despite the fact that the price of BTC spent more than two weeks flat, the capitalization of Bitcoin increased from $112 billion to $116 billion and on the weekly chart we already see the second green candle.
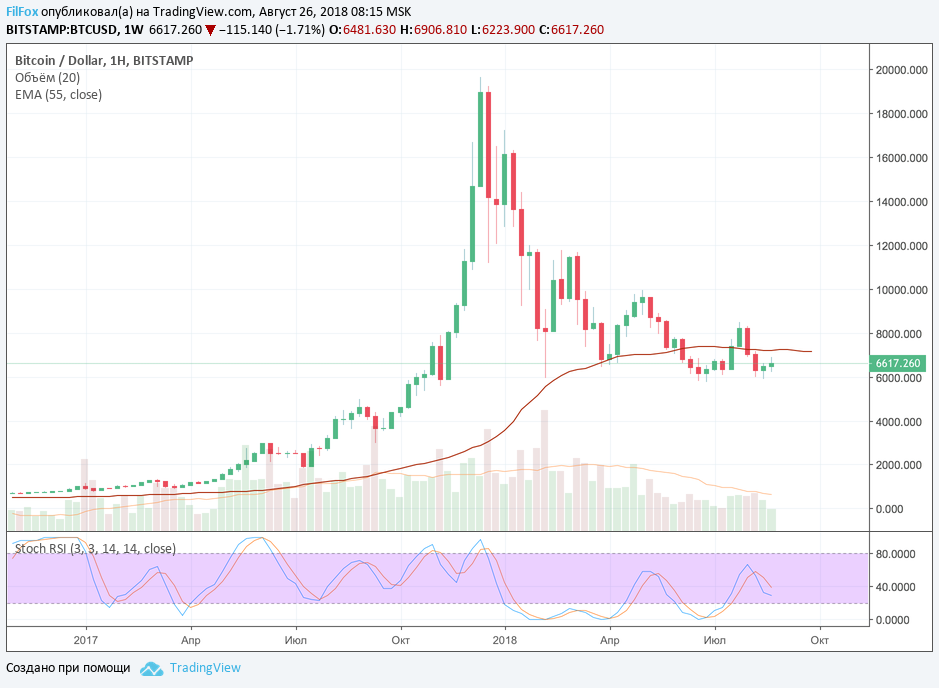
On the eight-hour and four-hour chart, the stochastic shows a decrease in price, but we believe that the candle will not change its color to red until the end of today's trading. To do this, it needs to hold above the level of 6480.00 USD. Approximately in this area is the moving average EMA55, which can provide support for the pair.
Next week an exit from the sideways range is expected. Whether the price will be able to leave the established corridor for a long time or will return to this range in the medium term will depend on the direction of the exit and the strength of the impulse.
ETH/USD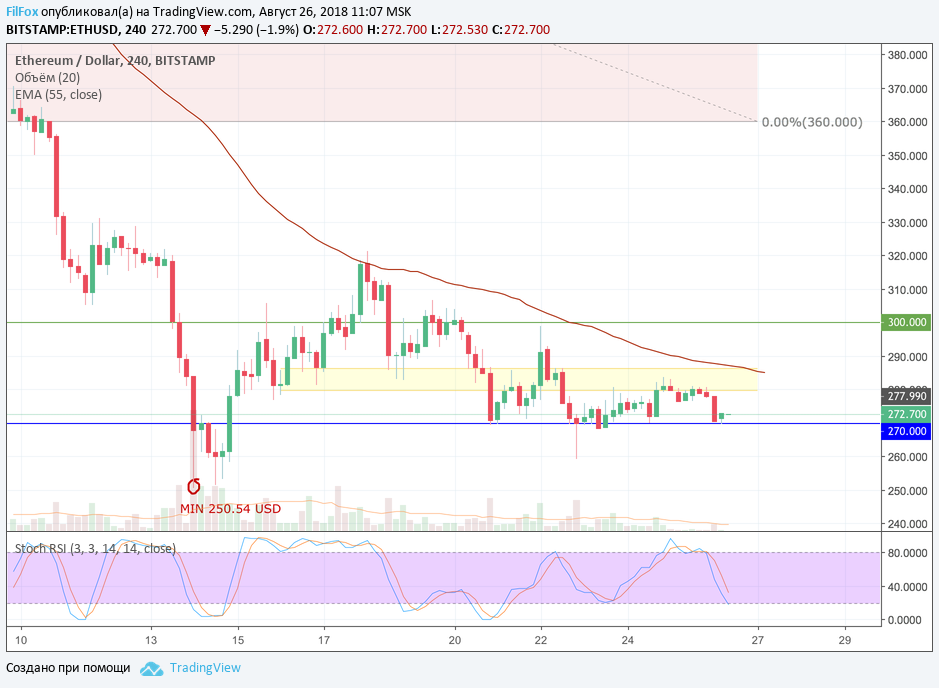
Ethereum spent the entire week sideways, relying on the support level of 270.00 USD. On Wednesday, August 22, succumbing to the provocation of a false breakout of the BTC/USD pair, ether was able to reach the upper limit of the range of 300.00 USD, but then returned to the narrow range between the lower limit of 270..00 USD and yellow resistance area.
Negative news on the ETF forced the price to break through the support level and set a weekly low at 262.60 USD. Today, the sideways trend is expected to continue and consolidation is expected at the level of the moving average EMA55, which is in the yellow resistance area.
XRP/USD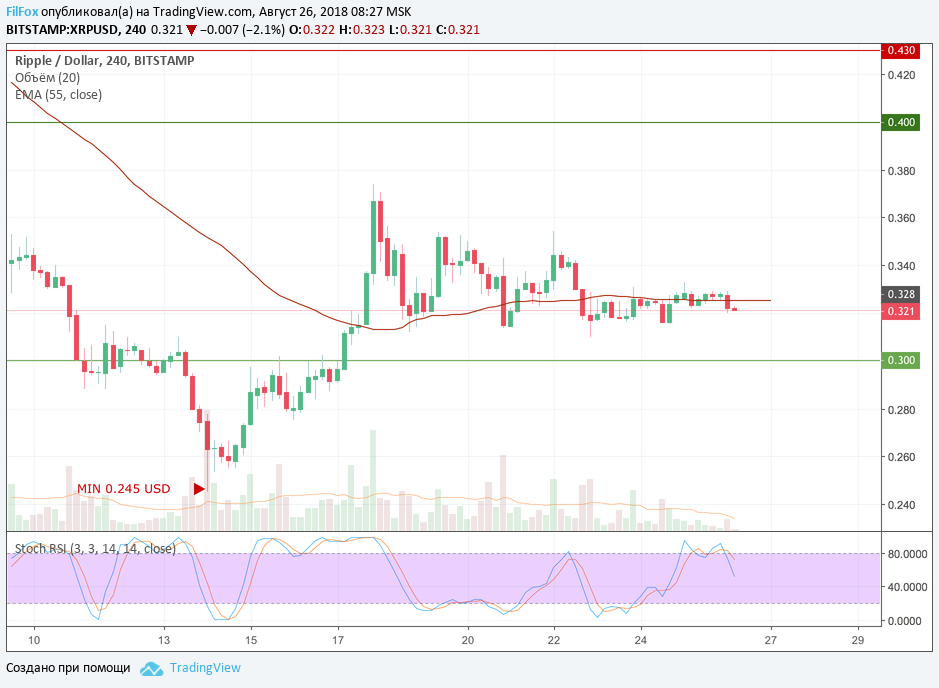
Ripple tried not to succumb to the provocations of the pump and negative fundamental events, so throughout the week it diligently narrowed the side range along the moving average EMA55. It seems that the pair is preparing for some strong impulse to exit the consolidation range. We identified the main levels of upcoming impulses as resistance at 0.430 USD and support in the area of the next annual minimum of 0.233 USD.
* All price values are based on data from the BitStamp exchange

You May Also Like
Price analysis of Bitcoin, Ethereum, XRP on 07/10/2021
Buyers are stuck in the area of average prices and cannot yet continue their recovery, and at the end of the current week there is a high probability of a resumption of the bearish onslaught.
ADA/USD analysis as of November 30, 2018
Cardano currency is good for its regular updates, which give a clear picture of the development process, which also affects the price. On the hourly chart we see a short-term bullish trend line with support at $0.0410.
