
The BCH/USD pair makes a U-reversal. The price continued to recover above the $675 level, then broke through the $680 resistance level
Later, BCH crossed the $700 mark. At the moment, bitcoin cash is trading above $680 and the 100 hourly MA. However, the price growth was stopped in the $723-725 area.
The maximum was formed at $723, after which a small downward correction began. There is now decent support above $680. On the hourly time frame we can also see a bullish candle forming near the $685 mark. This candle is close to the 38.2% fibonacci retracement.
So if prices move lower, they may find support near $680. On the other hand, if prices break through the $725 resistance level, the next target will be $750.
Let's look at the technical indicators:
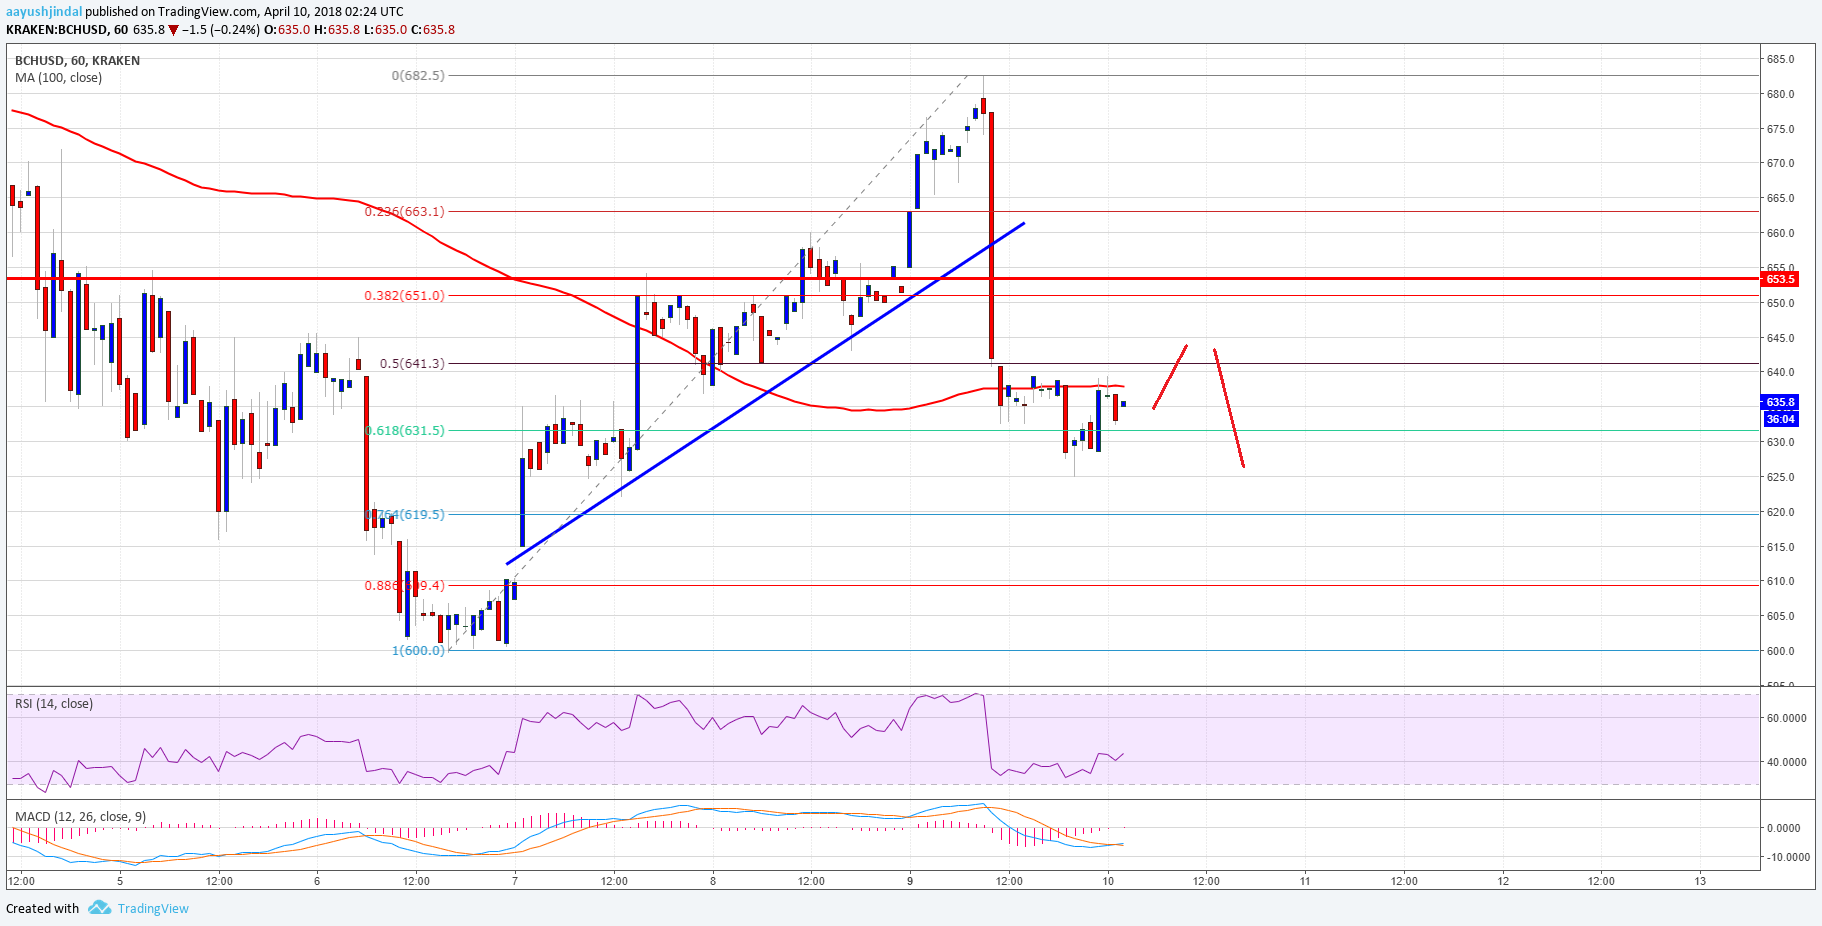
MACD indicator shows movement in the bearish zone
Relative Strength Index is just below the 50 mark
Major support level - $680
Major resistance level - $725
According to newsbtc.com

You May Also Like
Analysis of cryptocurrency pairs BTC/USD, XRP/USD and ETH/USD as of December 18, 2018
Target correction levels were achieved yesterday and today, during the day, a rollback from the overnight highs is planned
Analysis of Bitcoin Cash, EOS, Stellar Lumen and Litecoin as of December 26, 2018
If the decline from the morning high does not meet support at the level of average prices, then the pullback could be quite deep