
Consolidation continues. Price resist pressure
Bitcoin Cash price resists
Yesterday we could observe a minor price correction, which began at $625. The BCH price managed to rise above the resistance line at $650. The price broke through the 23.6% fibonacci. Later, at $640, the bullish pressure continued.
Be that as it may, prices were unable to close above $680 and the 100 hourly MA. As a result, we could see a negative reaction below $670. It is also important that there was a breakout below $665 on the hourly time frame.
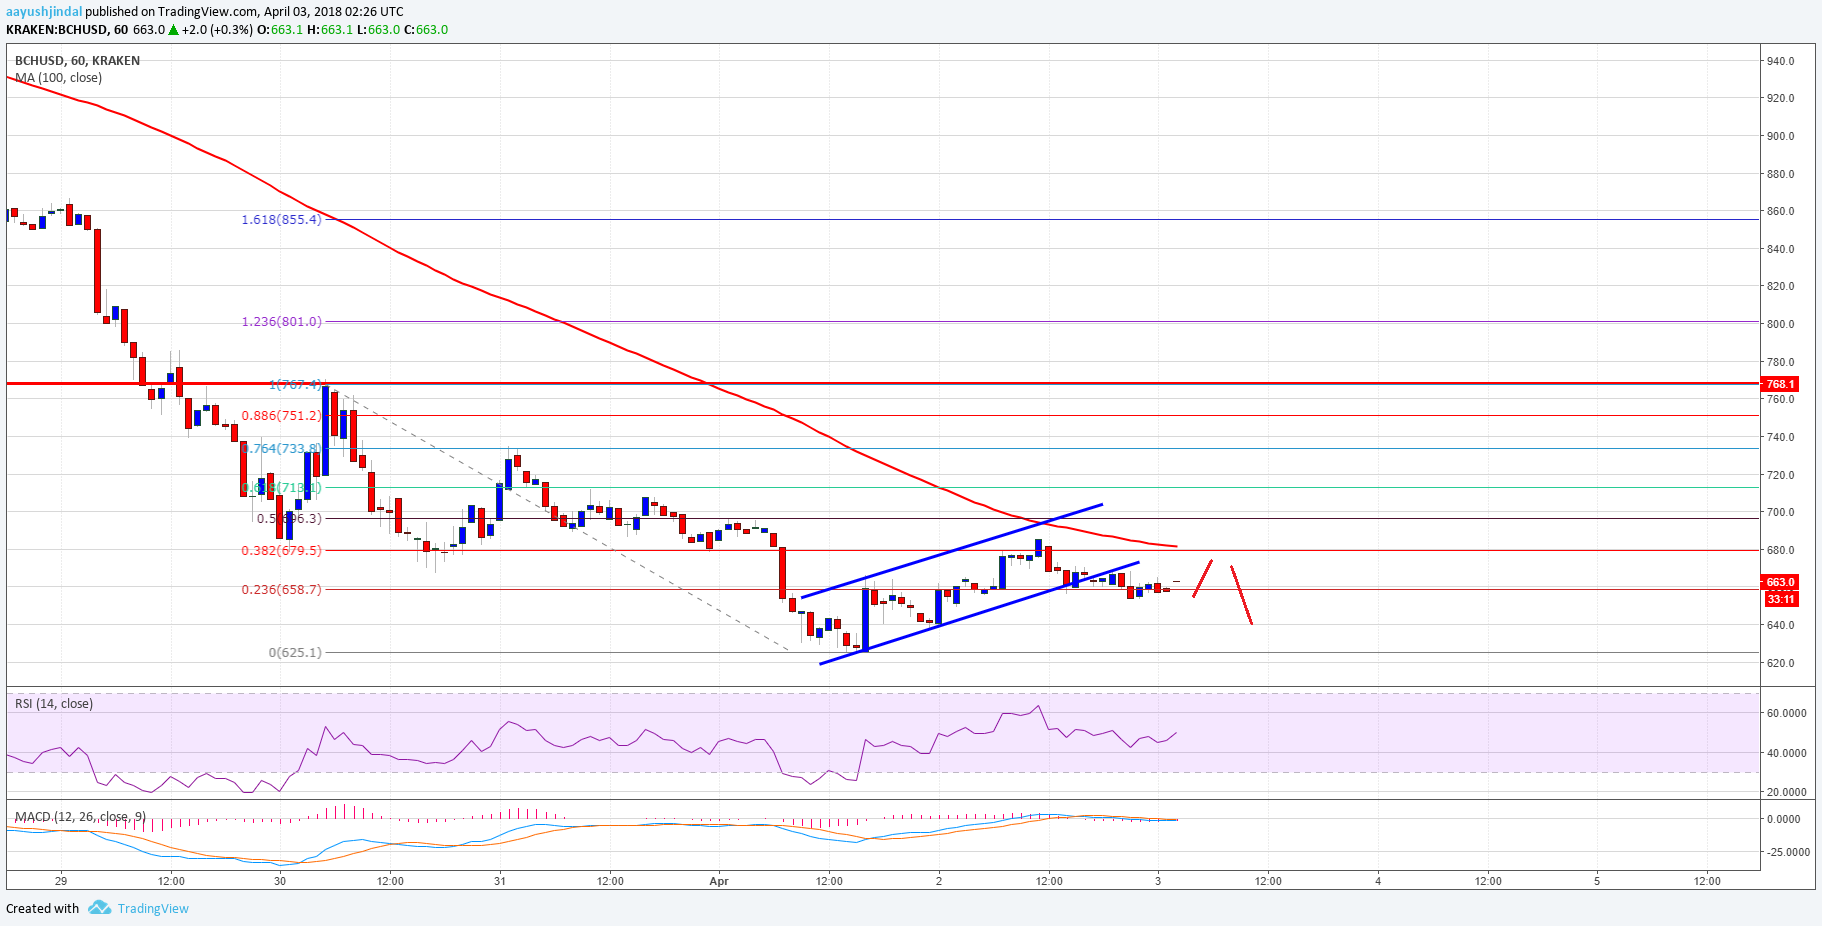
The BCH/USD pair is currently trading below the support line at $680, there are high chances of further depreciation. If BCH falls, there is a possibility of a retest of the $650 mark, and if the price closes below this level, then it may fall below $625.
Let's look at the technical indicators:
MADC indicator shows bearish momentum
The relative strength index is just above the 40 mark
The main support level is - $650
The main resistance level is $680
According to https://www.newsbtc.com

You May Also Like
Analysis of Stellar Lumen, Bitcoin Cash, EOS, and Litecoin as of 12/04/2018
The morning lows gave a good impetus for new purchases of altcoins. But will they continue when the price loses its attractiveness near yesterday's consolidation level? Let's look at the graphs
Bitcoin, Ethereum, XRP price analysis for 11/27/2021
Yesterday in the first half of the day, prices continued their local downtrend, marking new lows. The market has retreated to the support area, which could become the bottom of a downtrend.