
Yesterday we could observe a sharp upward movement in prices. Bitcoin Cash, Bitcoin and Ethereum have increased significantly in price. Bitcoin Cash price even managed to break through $720
The high was made at $743 before the price began to consolidate. It corrected slightly and tested the 23.6% Fibonacci level. However, the downward movement was stopped at the support level of $720. At the moment, it appears that a bullish breakout pattern is forming in the short term with resistance at $745 on the hourly time frame of the BCH/USD pair. If buyers continue to dominate, I expect the price to exceed $745 in the near future.
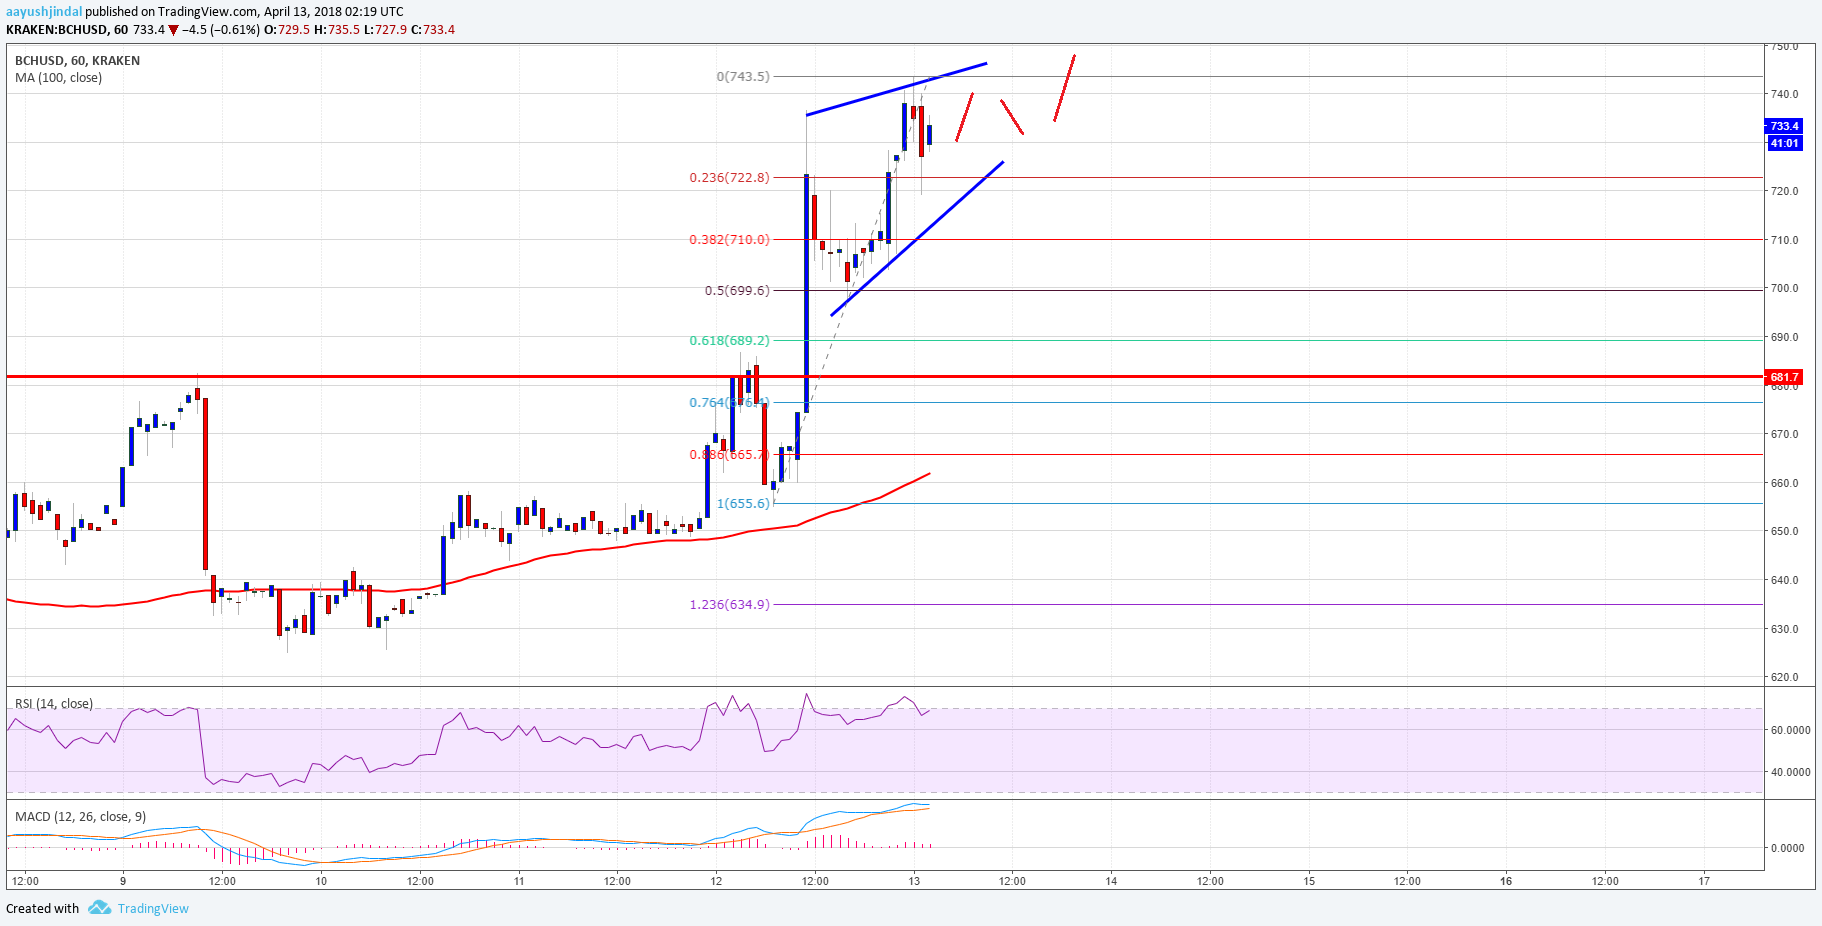
Looking further out, after $745 the price could rise to $750. On the other hand, there are many support levels at $720, $700, $680. Therefore, the chances that the price will go above $745 are very high.
Let's look at the technical indicators:
The MACD indicator is showing movement in the bullish zone
The relative strength index is near the oversold zone.
The main support level is $720
The main resistance level is $745
According to https://www.newsbtc.com

You May Also Like
Price analysis of Bitcoin, Ethereum, XRP as of 02/13/2021
Will the cryptocurrency flagship be able to break through the psychological level of 50,000.00 USD by the end of the week?
Price analysis of Bitcoin, Ethereum, XRP on 10/29/2021
The price of Ethereum breaks a historical record and updates its absolute maximum at the point of 4400.00 USD. Will the bulls be able to continue their run today?