
Yesterday we could observe a sharp upward movement in prices. Bitcoin Cash, Bitcoin and Ethereum have increased significantly in price. Bitcoin Cash price even managed to break through $720
The high was made at $743 before the price began to consolidate. It corrected slightly and tested the 23.6% Fibonacci level. However, the downward movement was stopped at the support level of $720. At the moment, it appears that a bullish breakout pattern is forming in the short term with resistance at $745 on the hourly time frame of the BCH/USD pair. If buyers continue to dominate, I expect the price to exceed $745 in the near future.
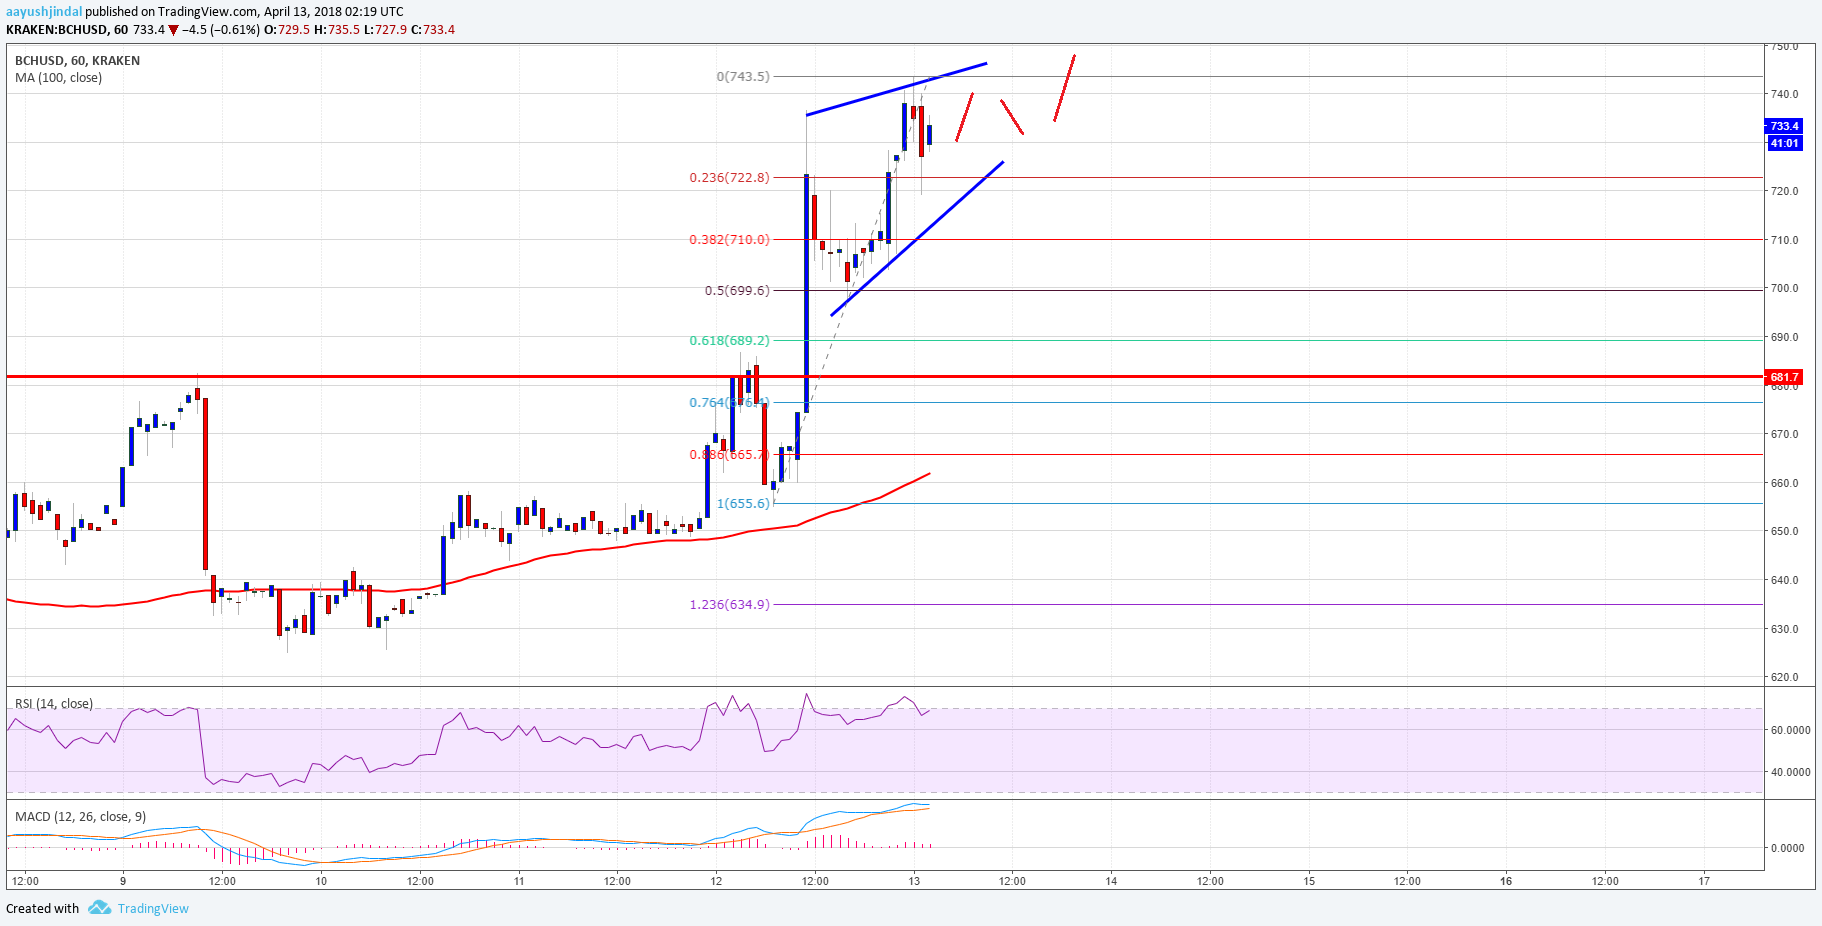
Looking further out, after $745 the price could rise to $750. On the other hand, there are many support levels at $720, $700, $680. Therefore, the chances that the price will go above $745 are very high.
Let's look at the technical indicators:
The MACD indicator is showing movement in the bullish zone
The relative strength index is near the oversold zone.
The main support level is $720
The main resistance level is $745
According to https://www.newsbtc.com

You May Also Like
Analysis of ADA and XMR as of November 26, 2018
After several weeks of severe price losses, some of the altcoins may recover to the nearest resistance level.
Analysis of cryptocurrency pairs BTC/USD, XRP/USD and ETH/USD as of December 25, 2018
Yesterday's sharp increase in market volatility may give way to consolidation in a narrow range
