
Consolidation continues. Price resist pressure
Bitcoin Cash price resists
Yesterday we could observe a minor price correction, which began at $625. The BCH price managed to rise above the resistance line at $650. The price broke through the 23.6% fibonacci. Later, at $640, the bullish pressure continued.
Be that as it may, prices were unable to close above $680 and the 100 hourly MA. As a result, we could see a negative reaction below $670. It is also important that there was a breakout below $665 on the hourly time frame.
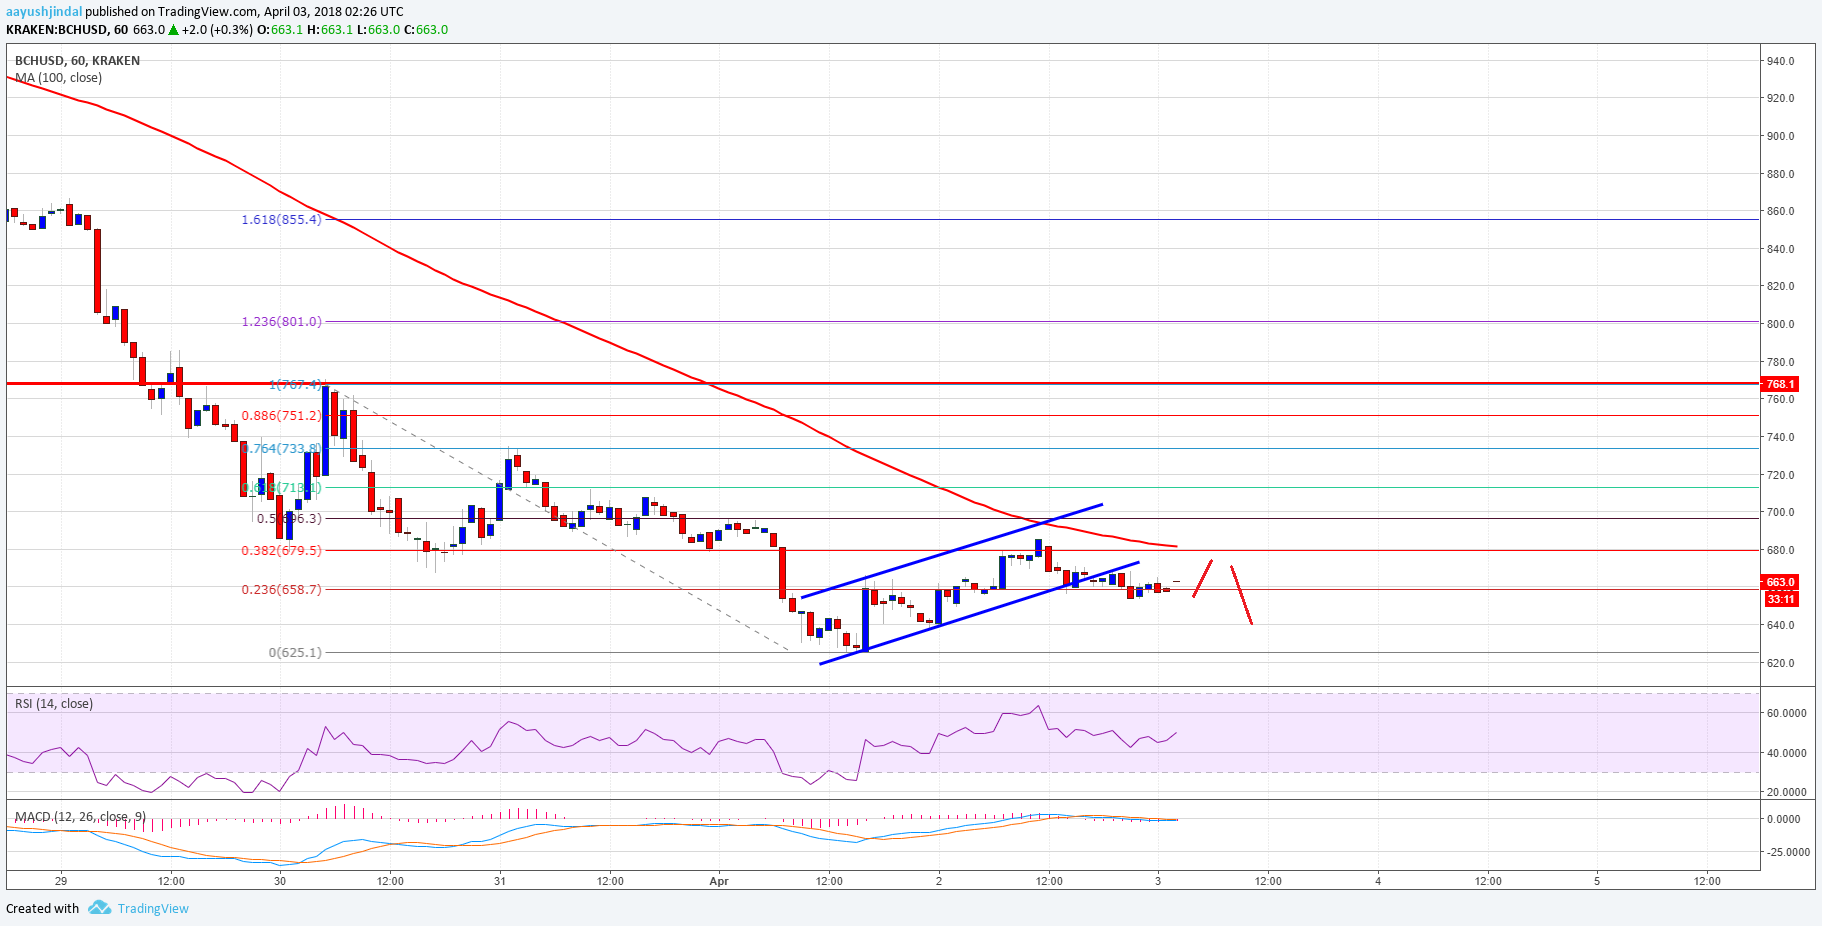
The BCH/USD pair is currently trading below the support line at $680, there are high chances of further depreciation. If BCH falls, there is a possibility of a retest of the $650 mark, and if the price closes below this level, then it may fall below $625.
Let's look at the technical indicators:
MADC indicator shows bearish momentum
The relative strength index is just above the 40 mark
The main support level is - $650
The main resistance level is $680
According to https://www.newsbtc.com

You May Also Like
Analysis of cryptocurrency pairs BTC/USD, XRP/USD and ETH/USD as of December 24, 2018
The market has so far managed to maintain positive dynamics and increase its capitalization level to $142 billion
Analysis of Stellar Lumen, Bitcoin Cash, EOS, and Litecoin as of 12/10/2018
Despite the current decline, the market recovery phase has not yet ended. We determine the nearest resistance levels for correction.